 MASTERESTAURANT®
Food & beverage cost as % of sales at US full-service restaurants (2024 median)
National Restaurant AssociationMASTERESTAURANT® Toolkit · Indicators
DIEGO F PARRA · CREATOR OF THE MASTERESTAURANT® METHODOLOGY
Restaurant KPIs the key indicators, with formulas and a free sheetThe MASTERESTAURANT indicator sheet: costs, finance, marketing, service, guests and sales
Restaurant KPIs are the indicators that tell you, with a fixed formula and frequency, whether the business makes money, serves well and sells more. The MASTERESTAURANT sheet brings together nearly 60, organized by restaurant area, free to download and in Spanish.
See all the tools8,400+restaurants apply his methodology
43countries with supported groups
65M+views per year
2service languages: EN - ES
Toolkit sheets
The KPI sheet and the ones that go with it (in Spanish)
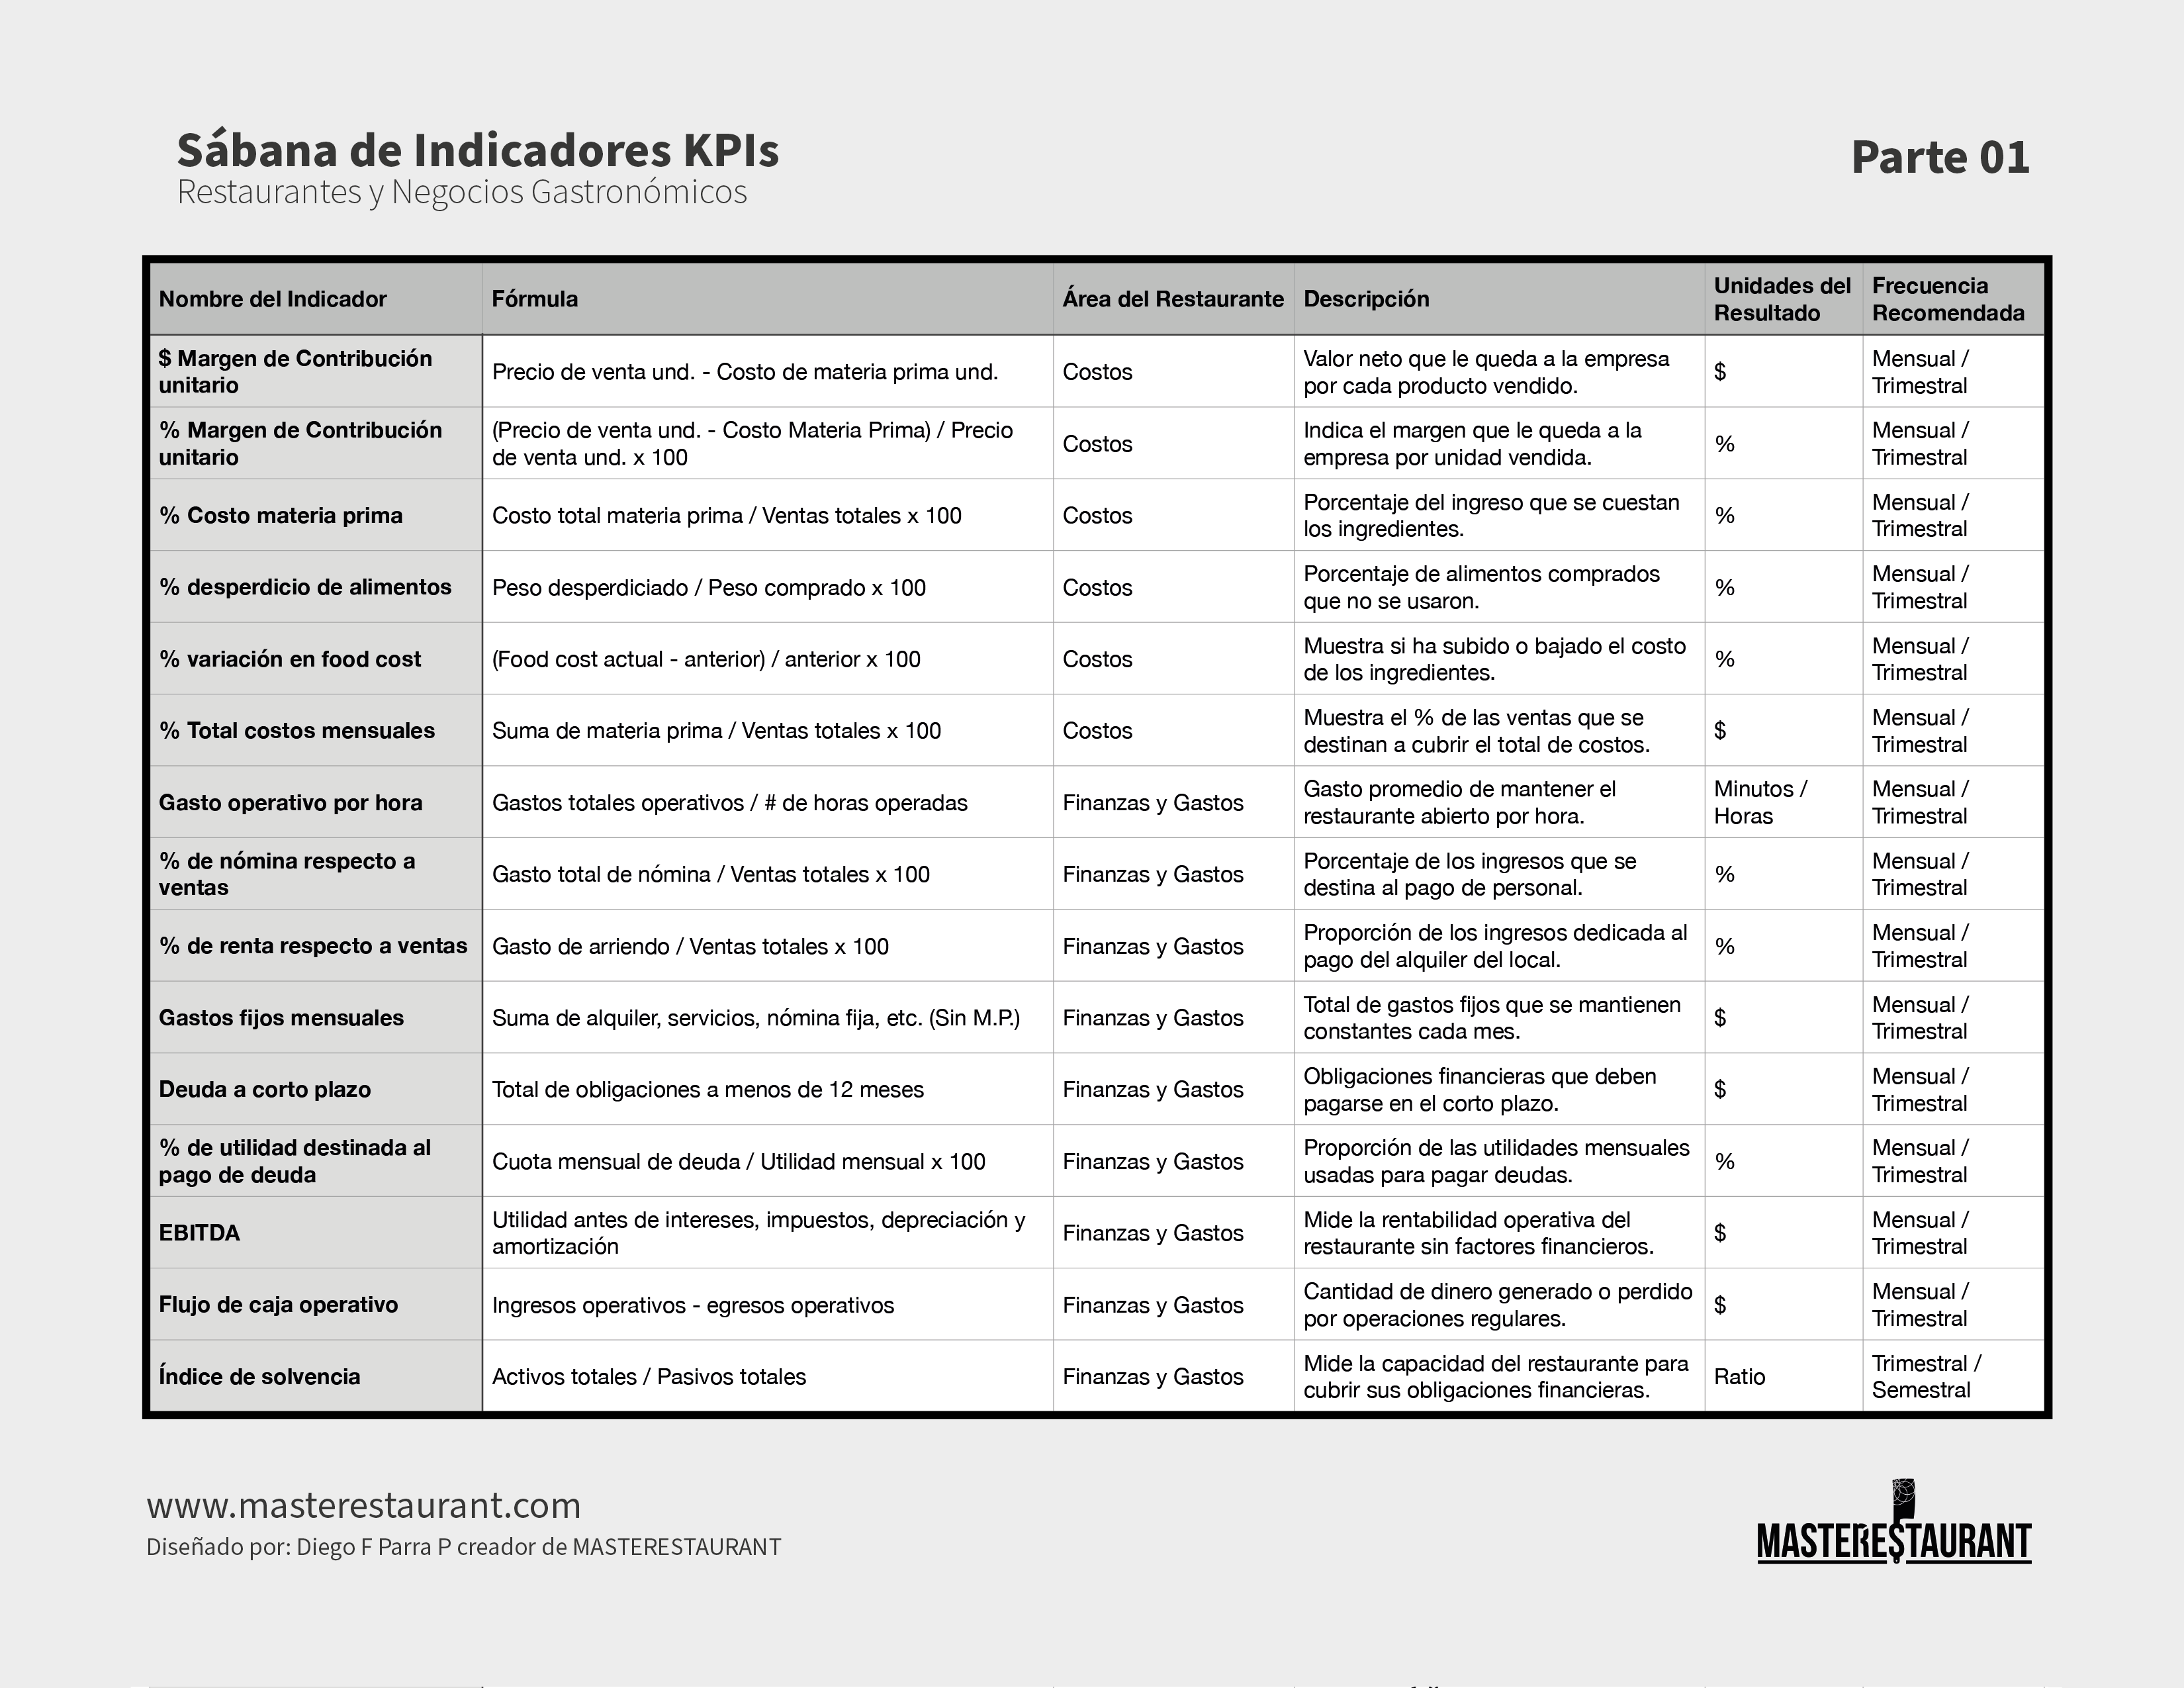
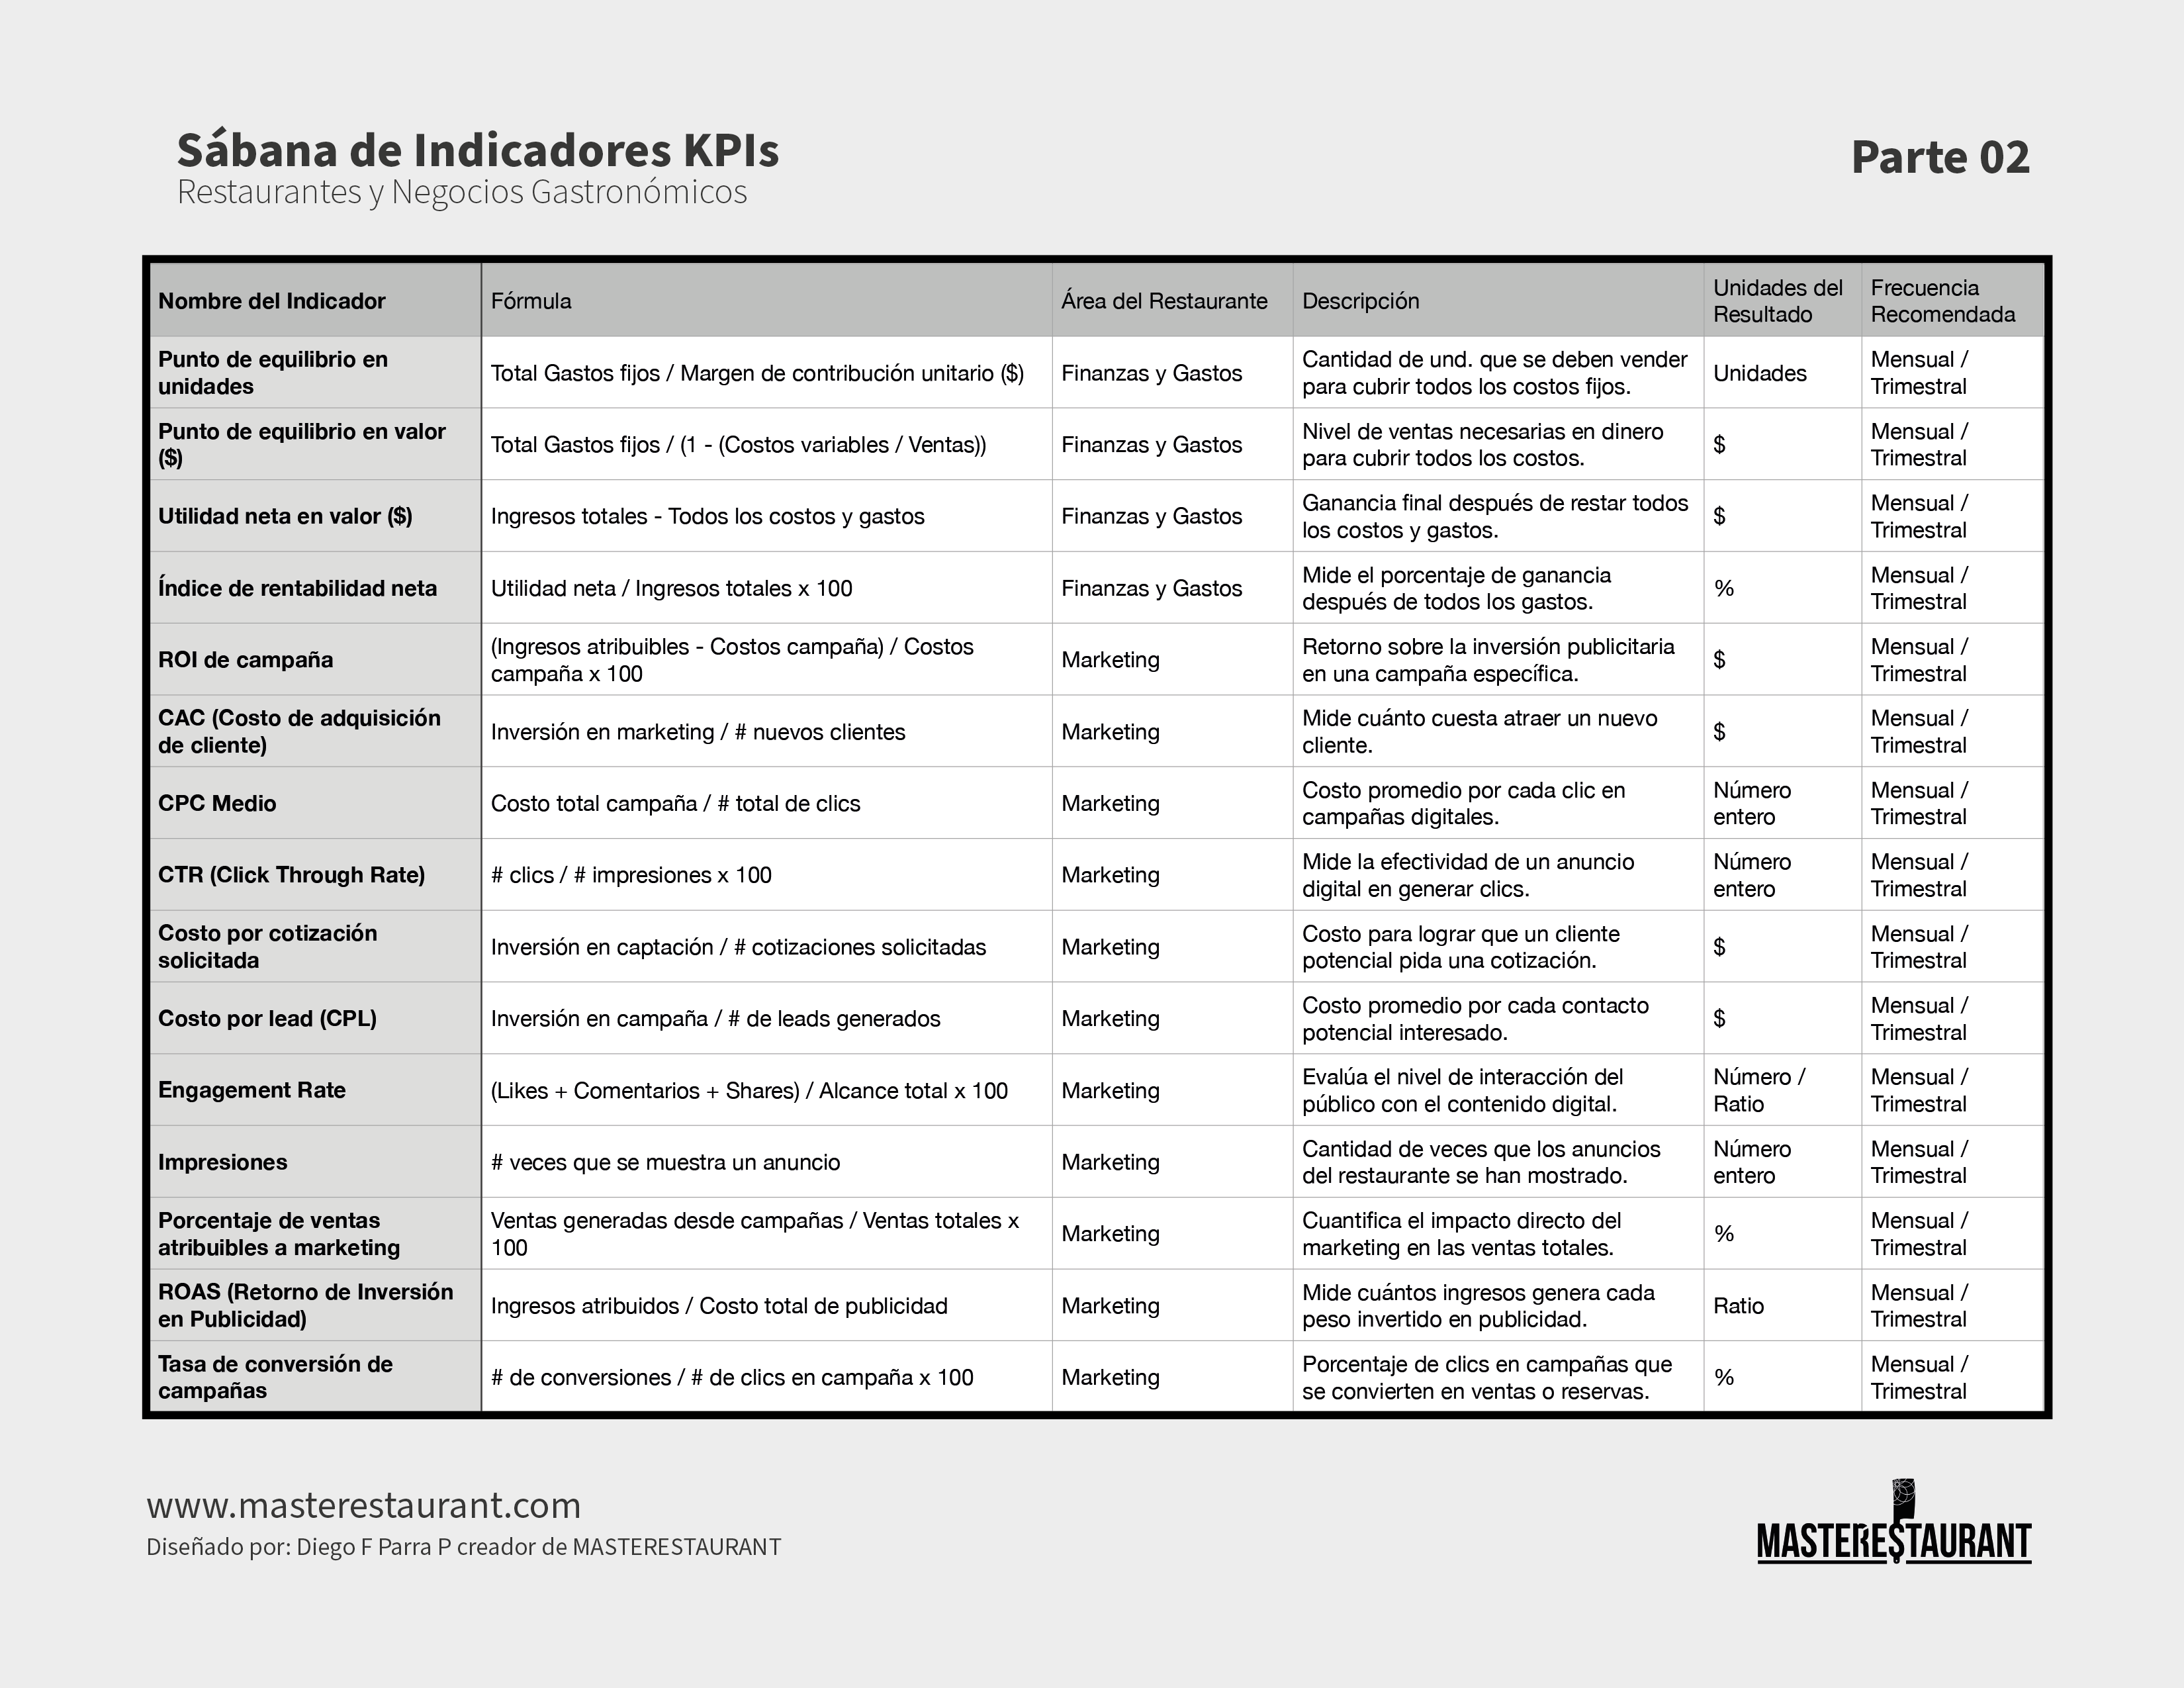
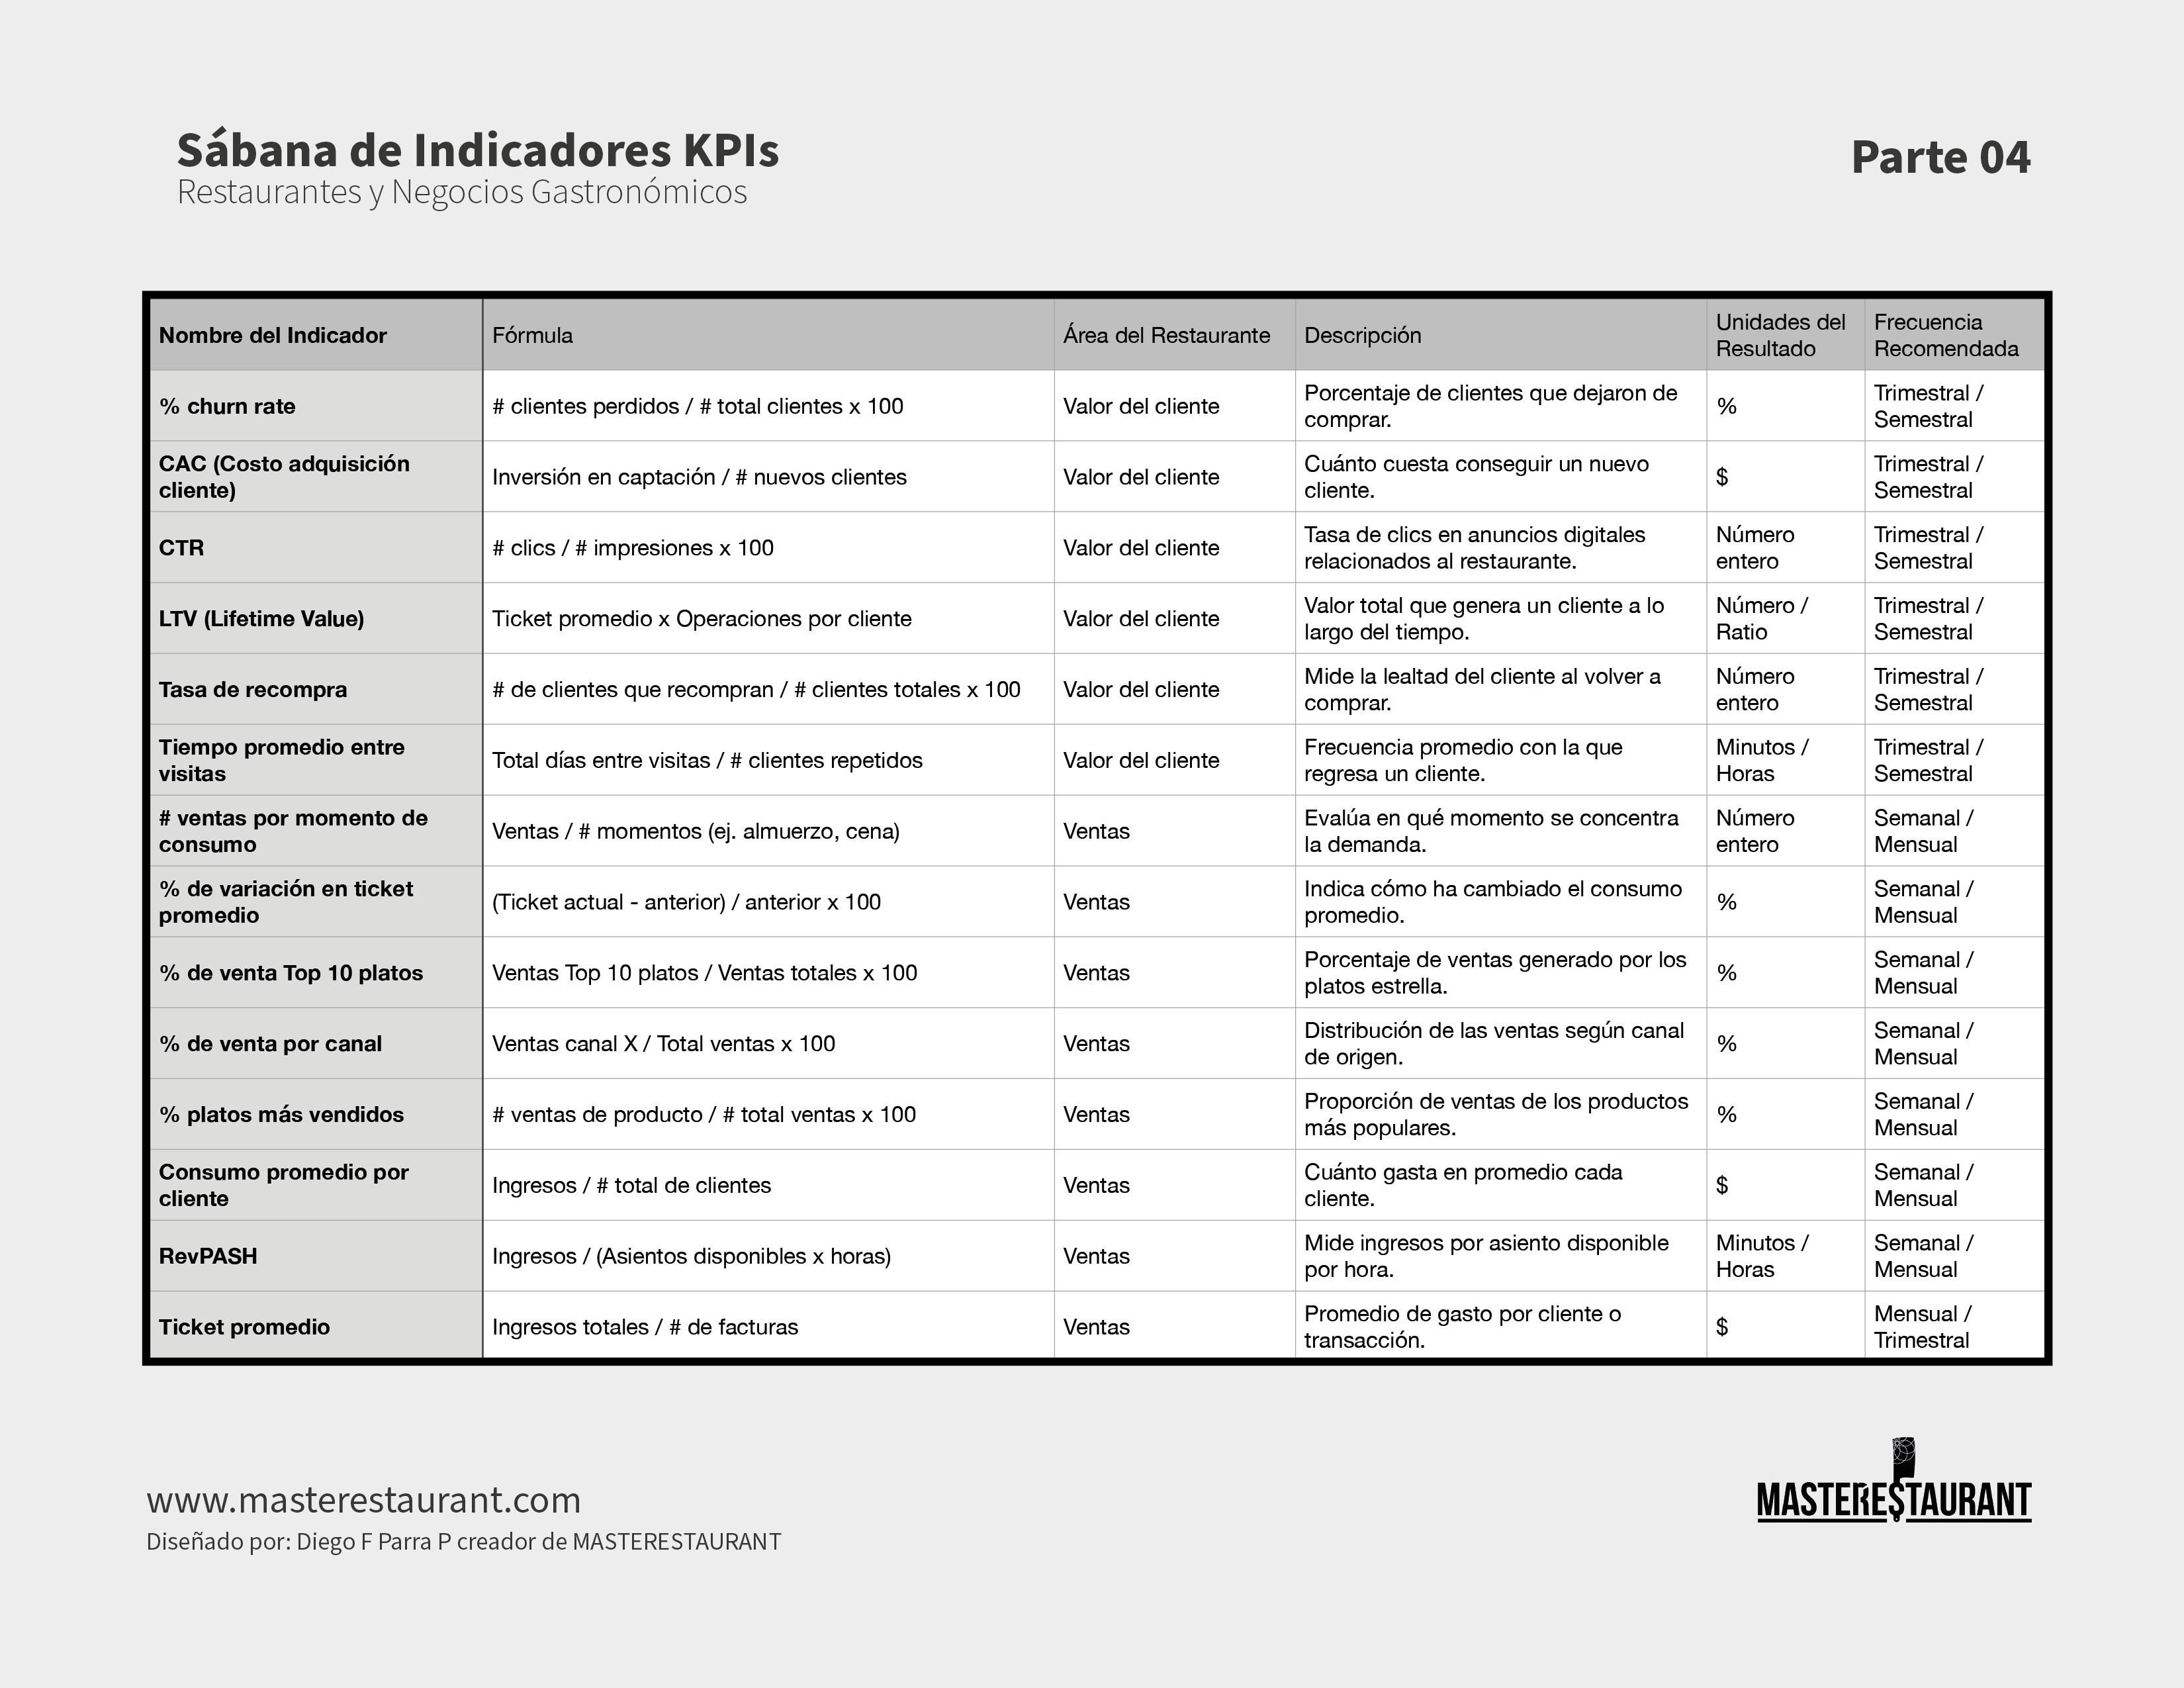
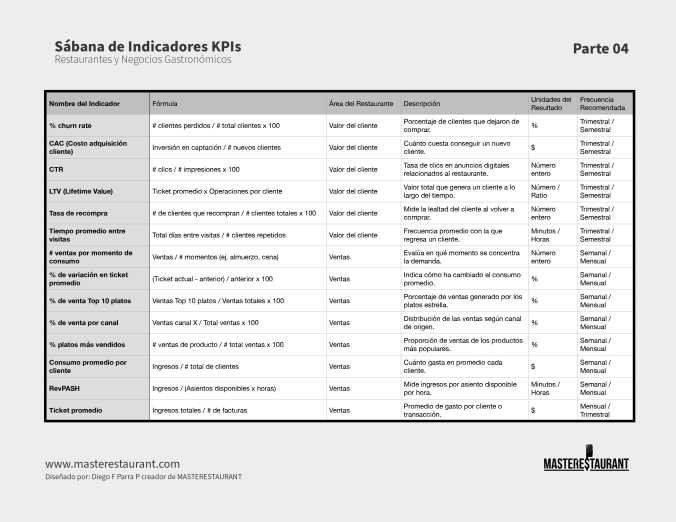
Restaurant KPI sheet (in Spanish)
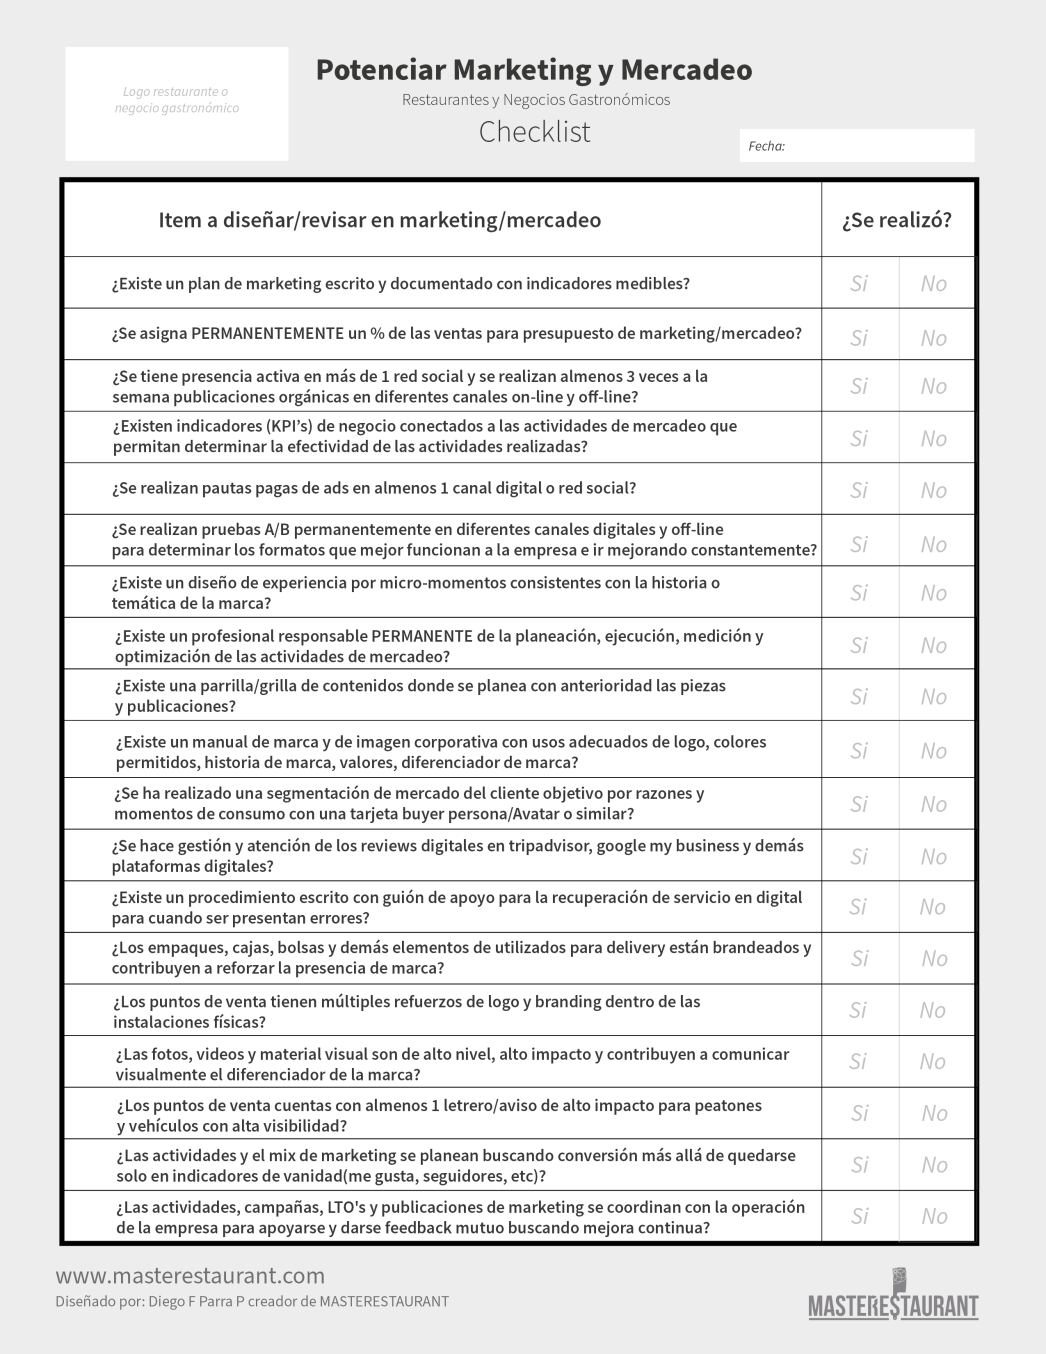
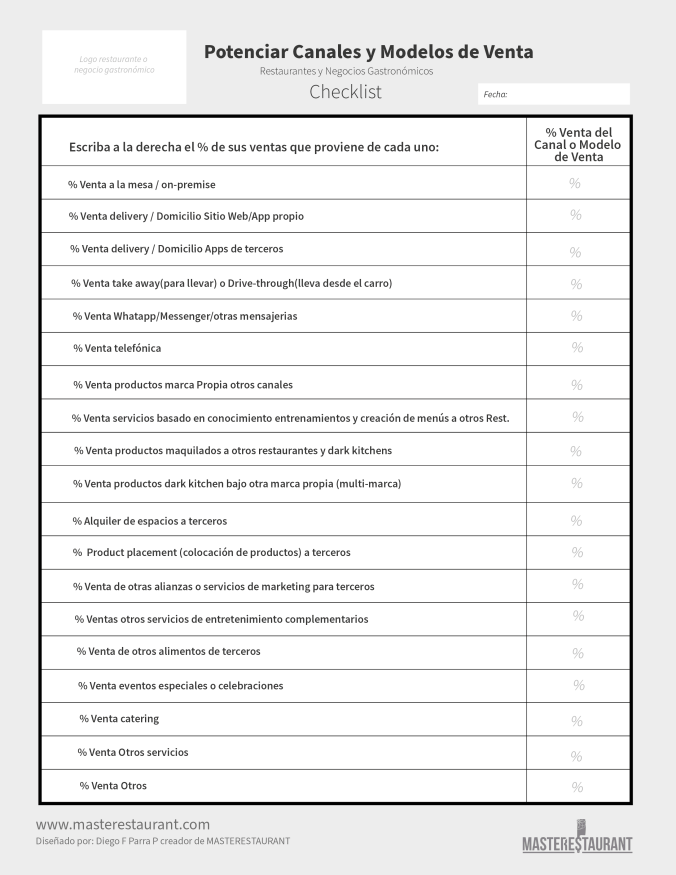
Nearly 60 indicators across four sheets, each with formula, restaurant area, description, unit and recommended frequency.
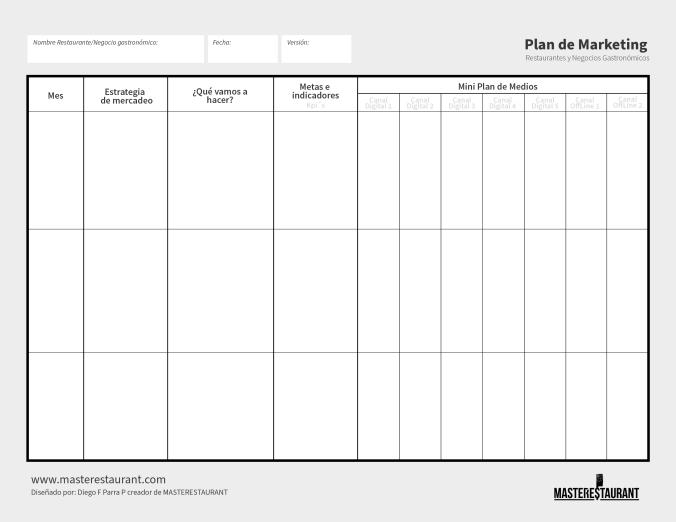
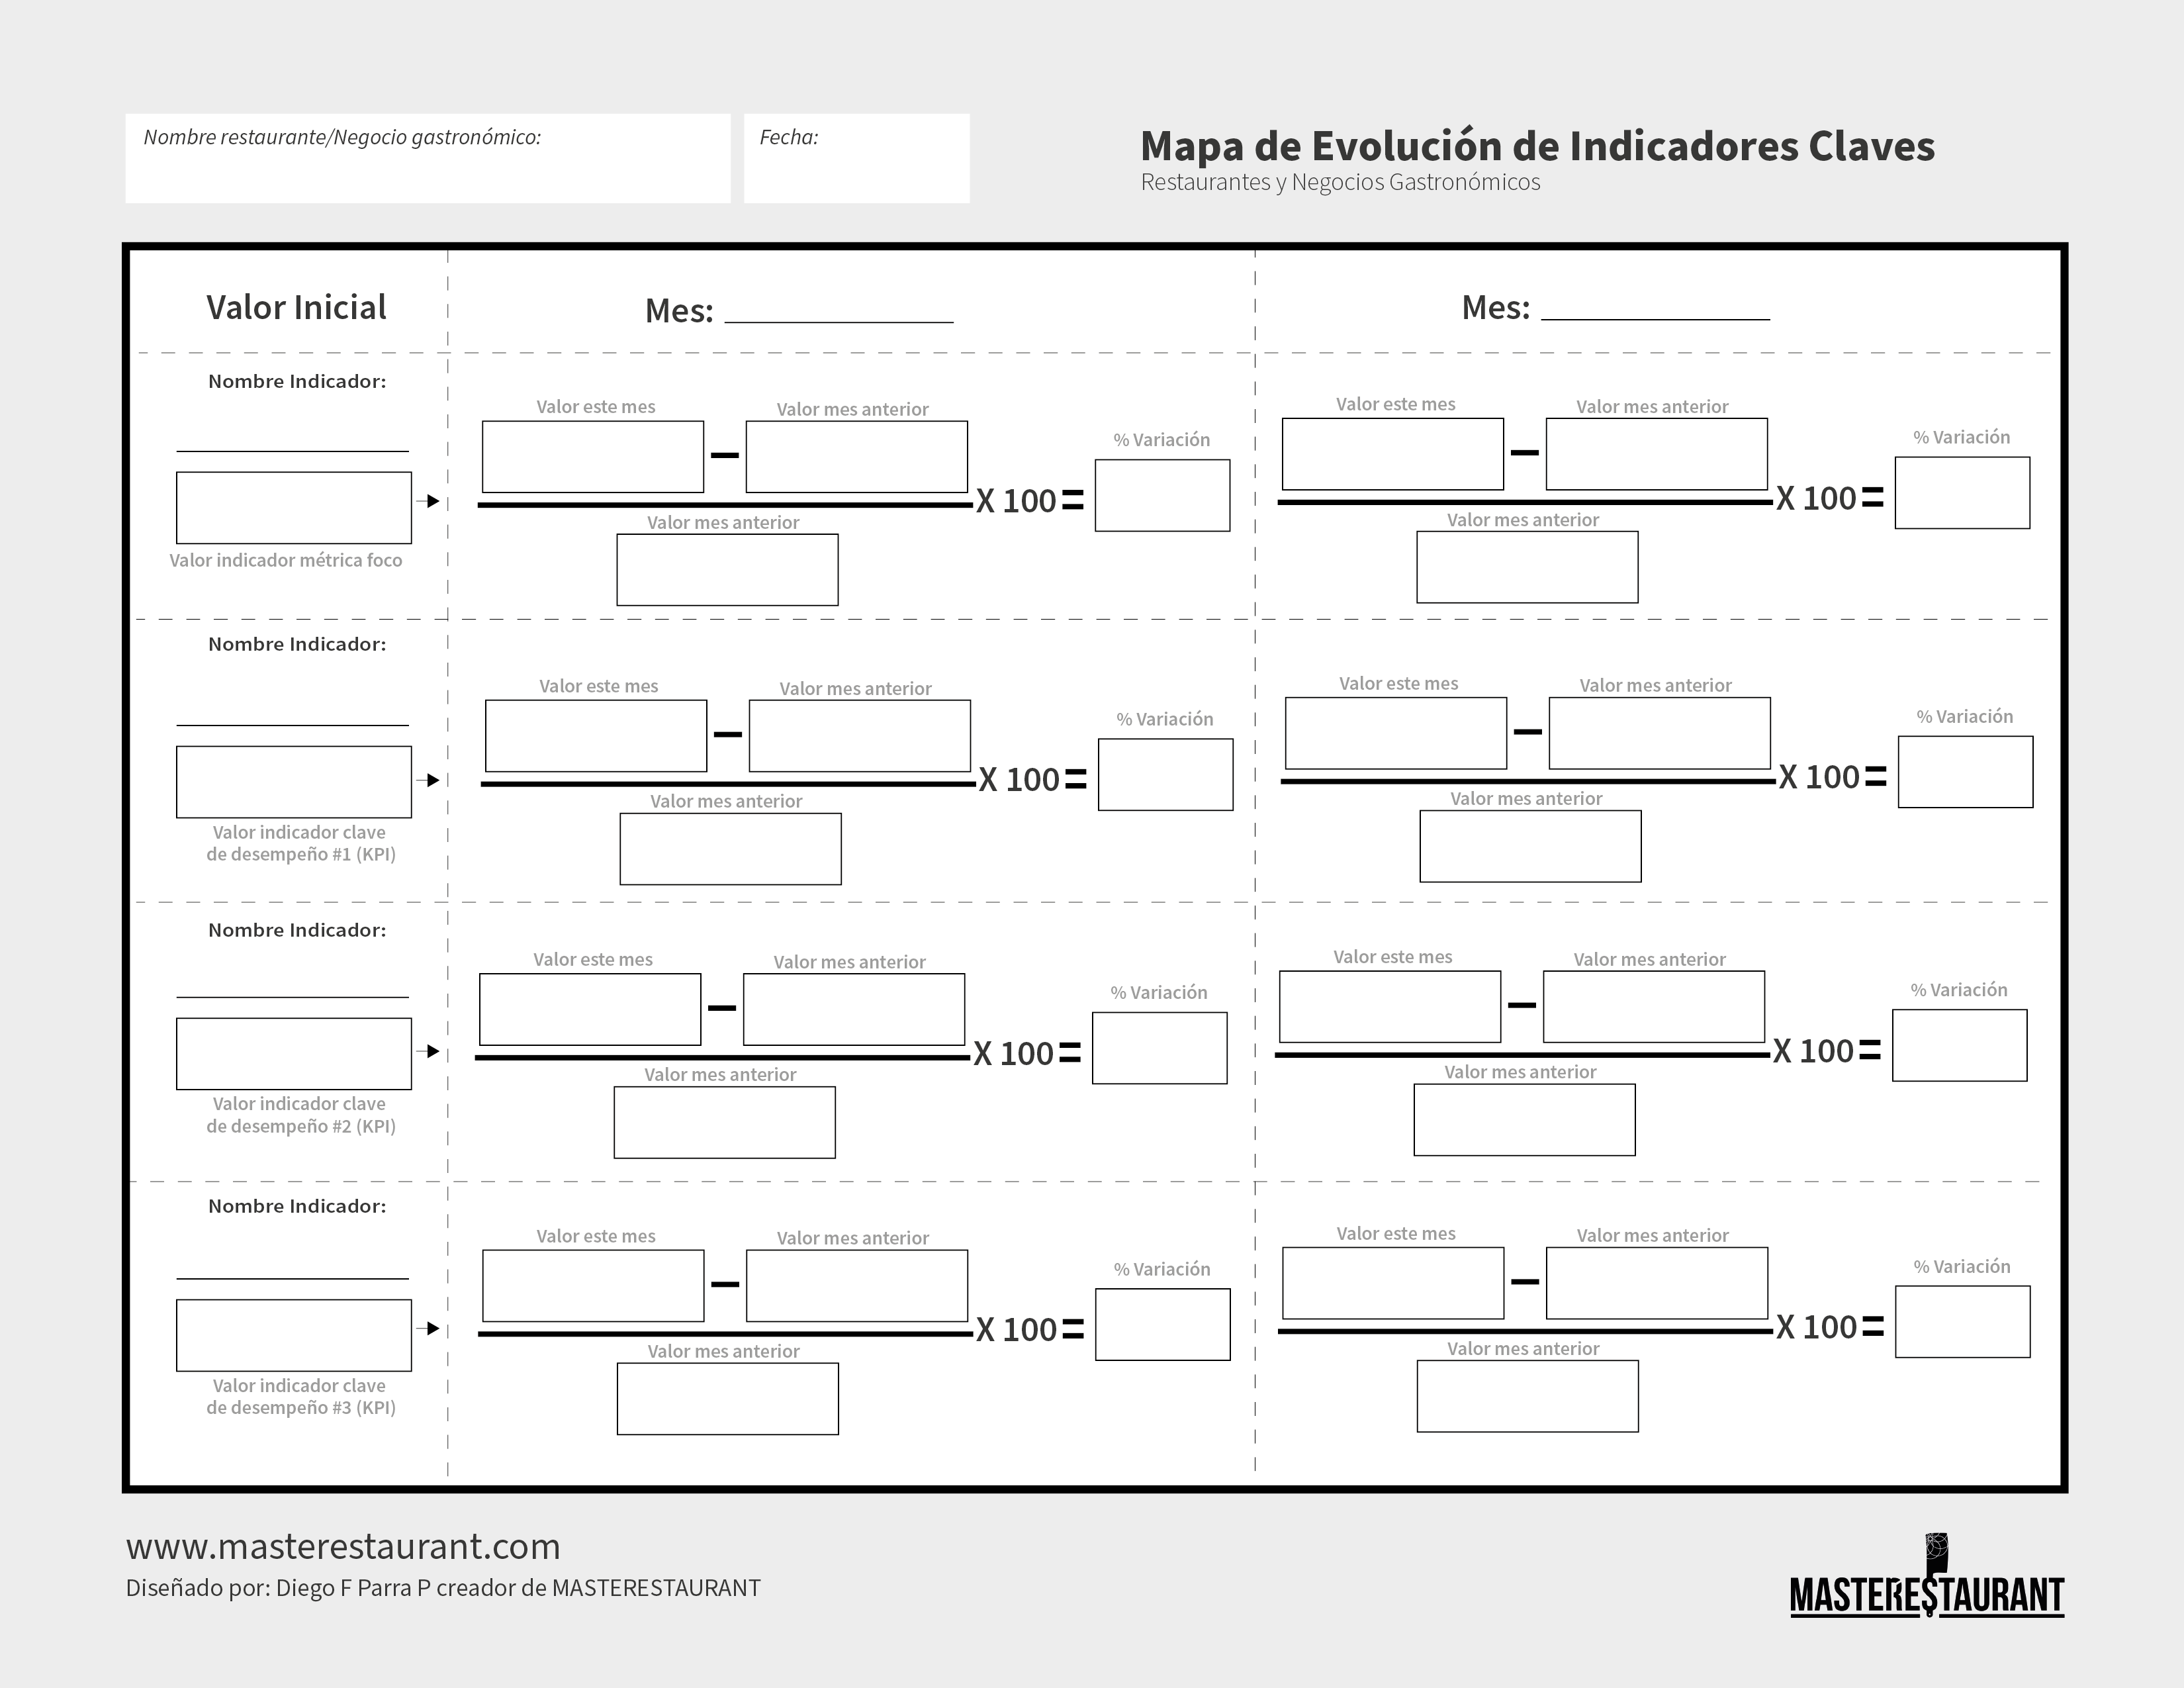
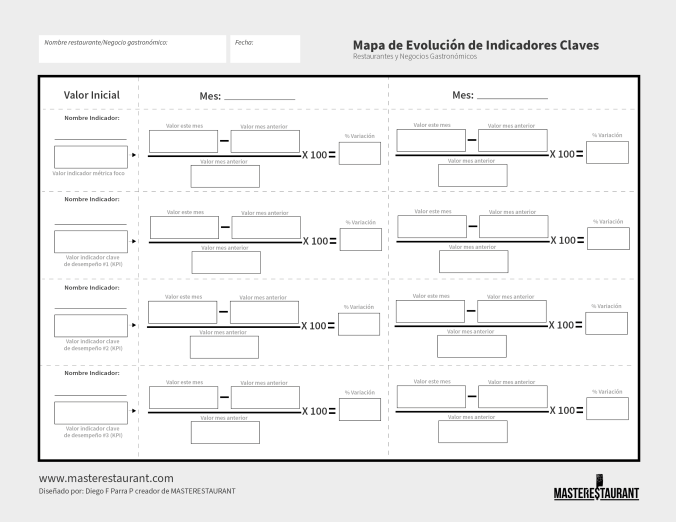
Key indicator evolution map
The starting value of your focus metric and three KPIs, and their month-over-month percentage change.
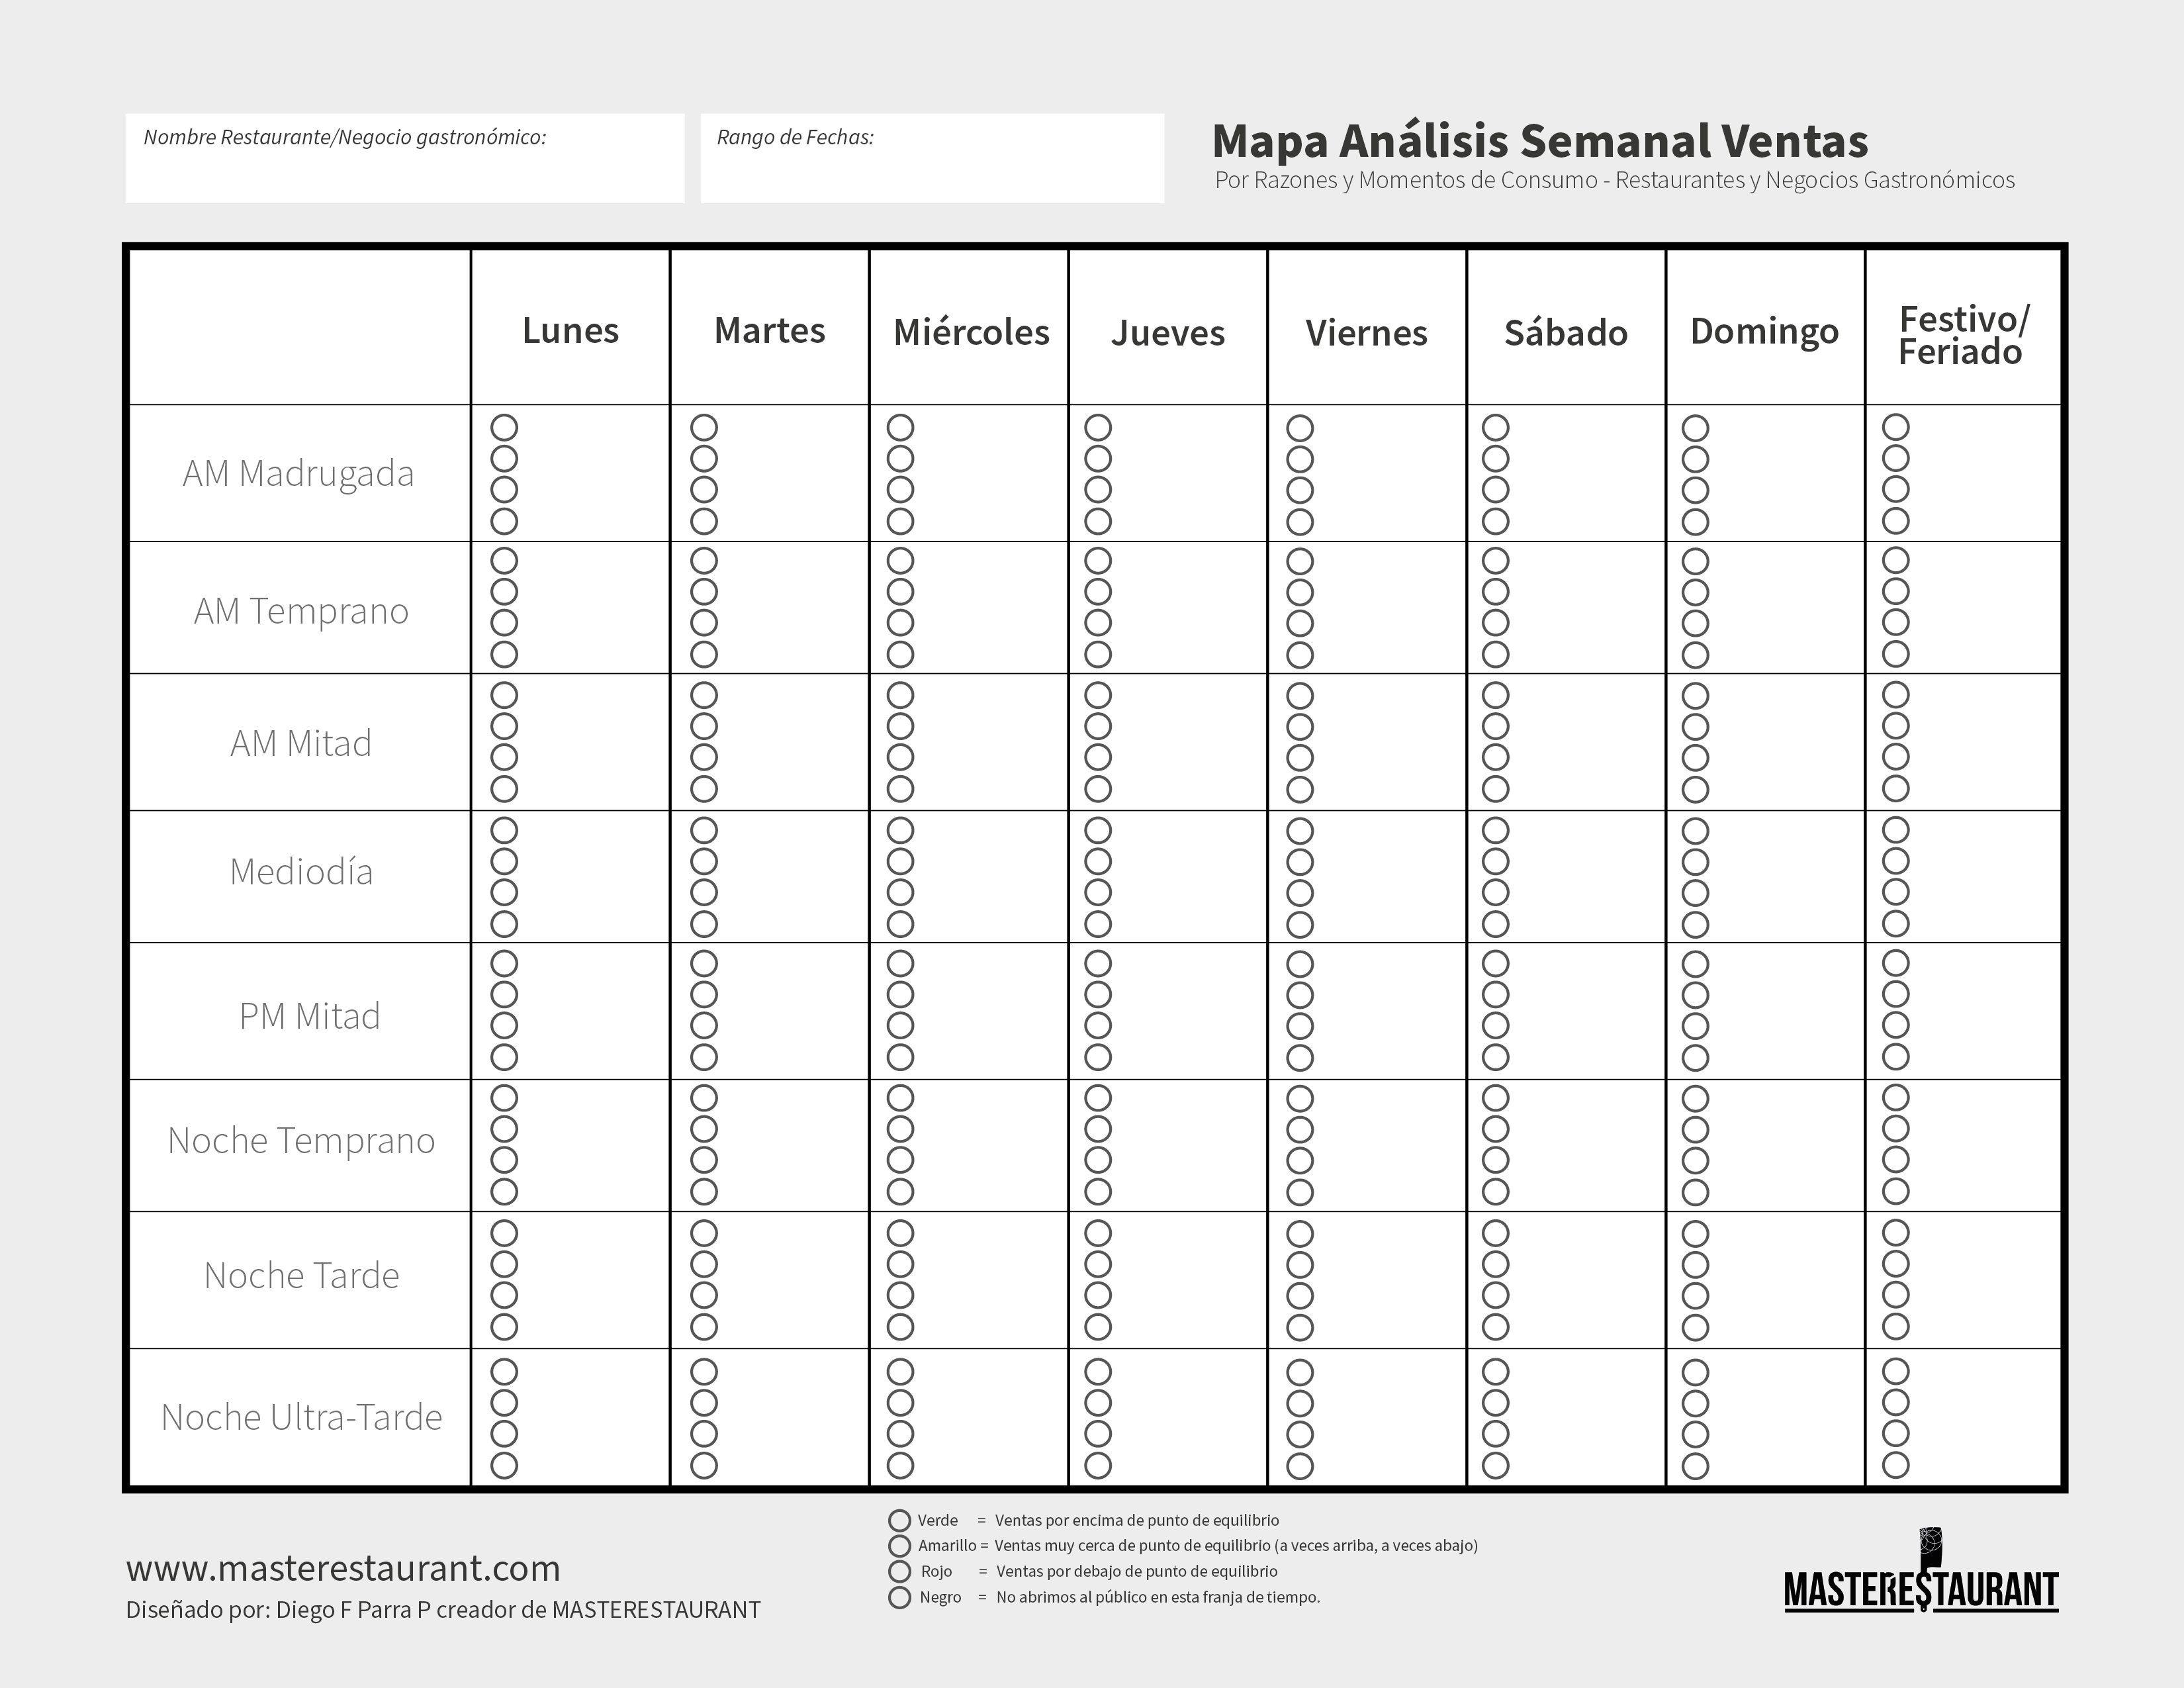
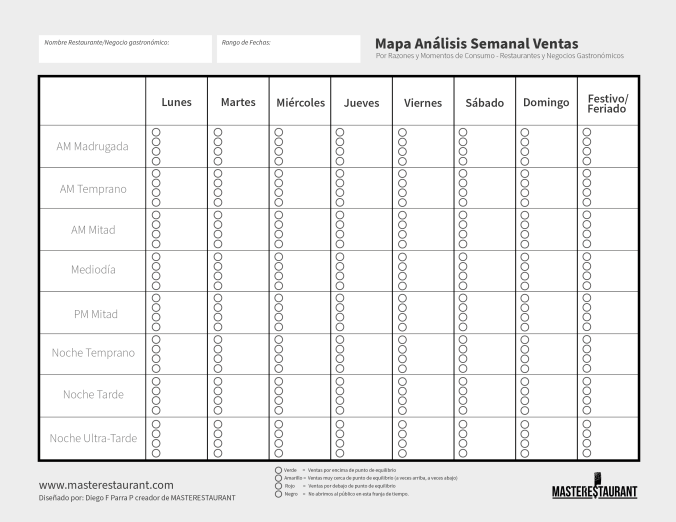
Weekly sales analysis map
Sales for each day and time slot, marked above, near or below break-even.
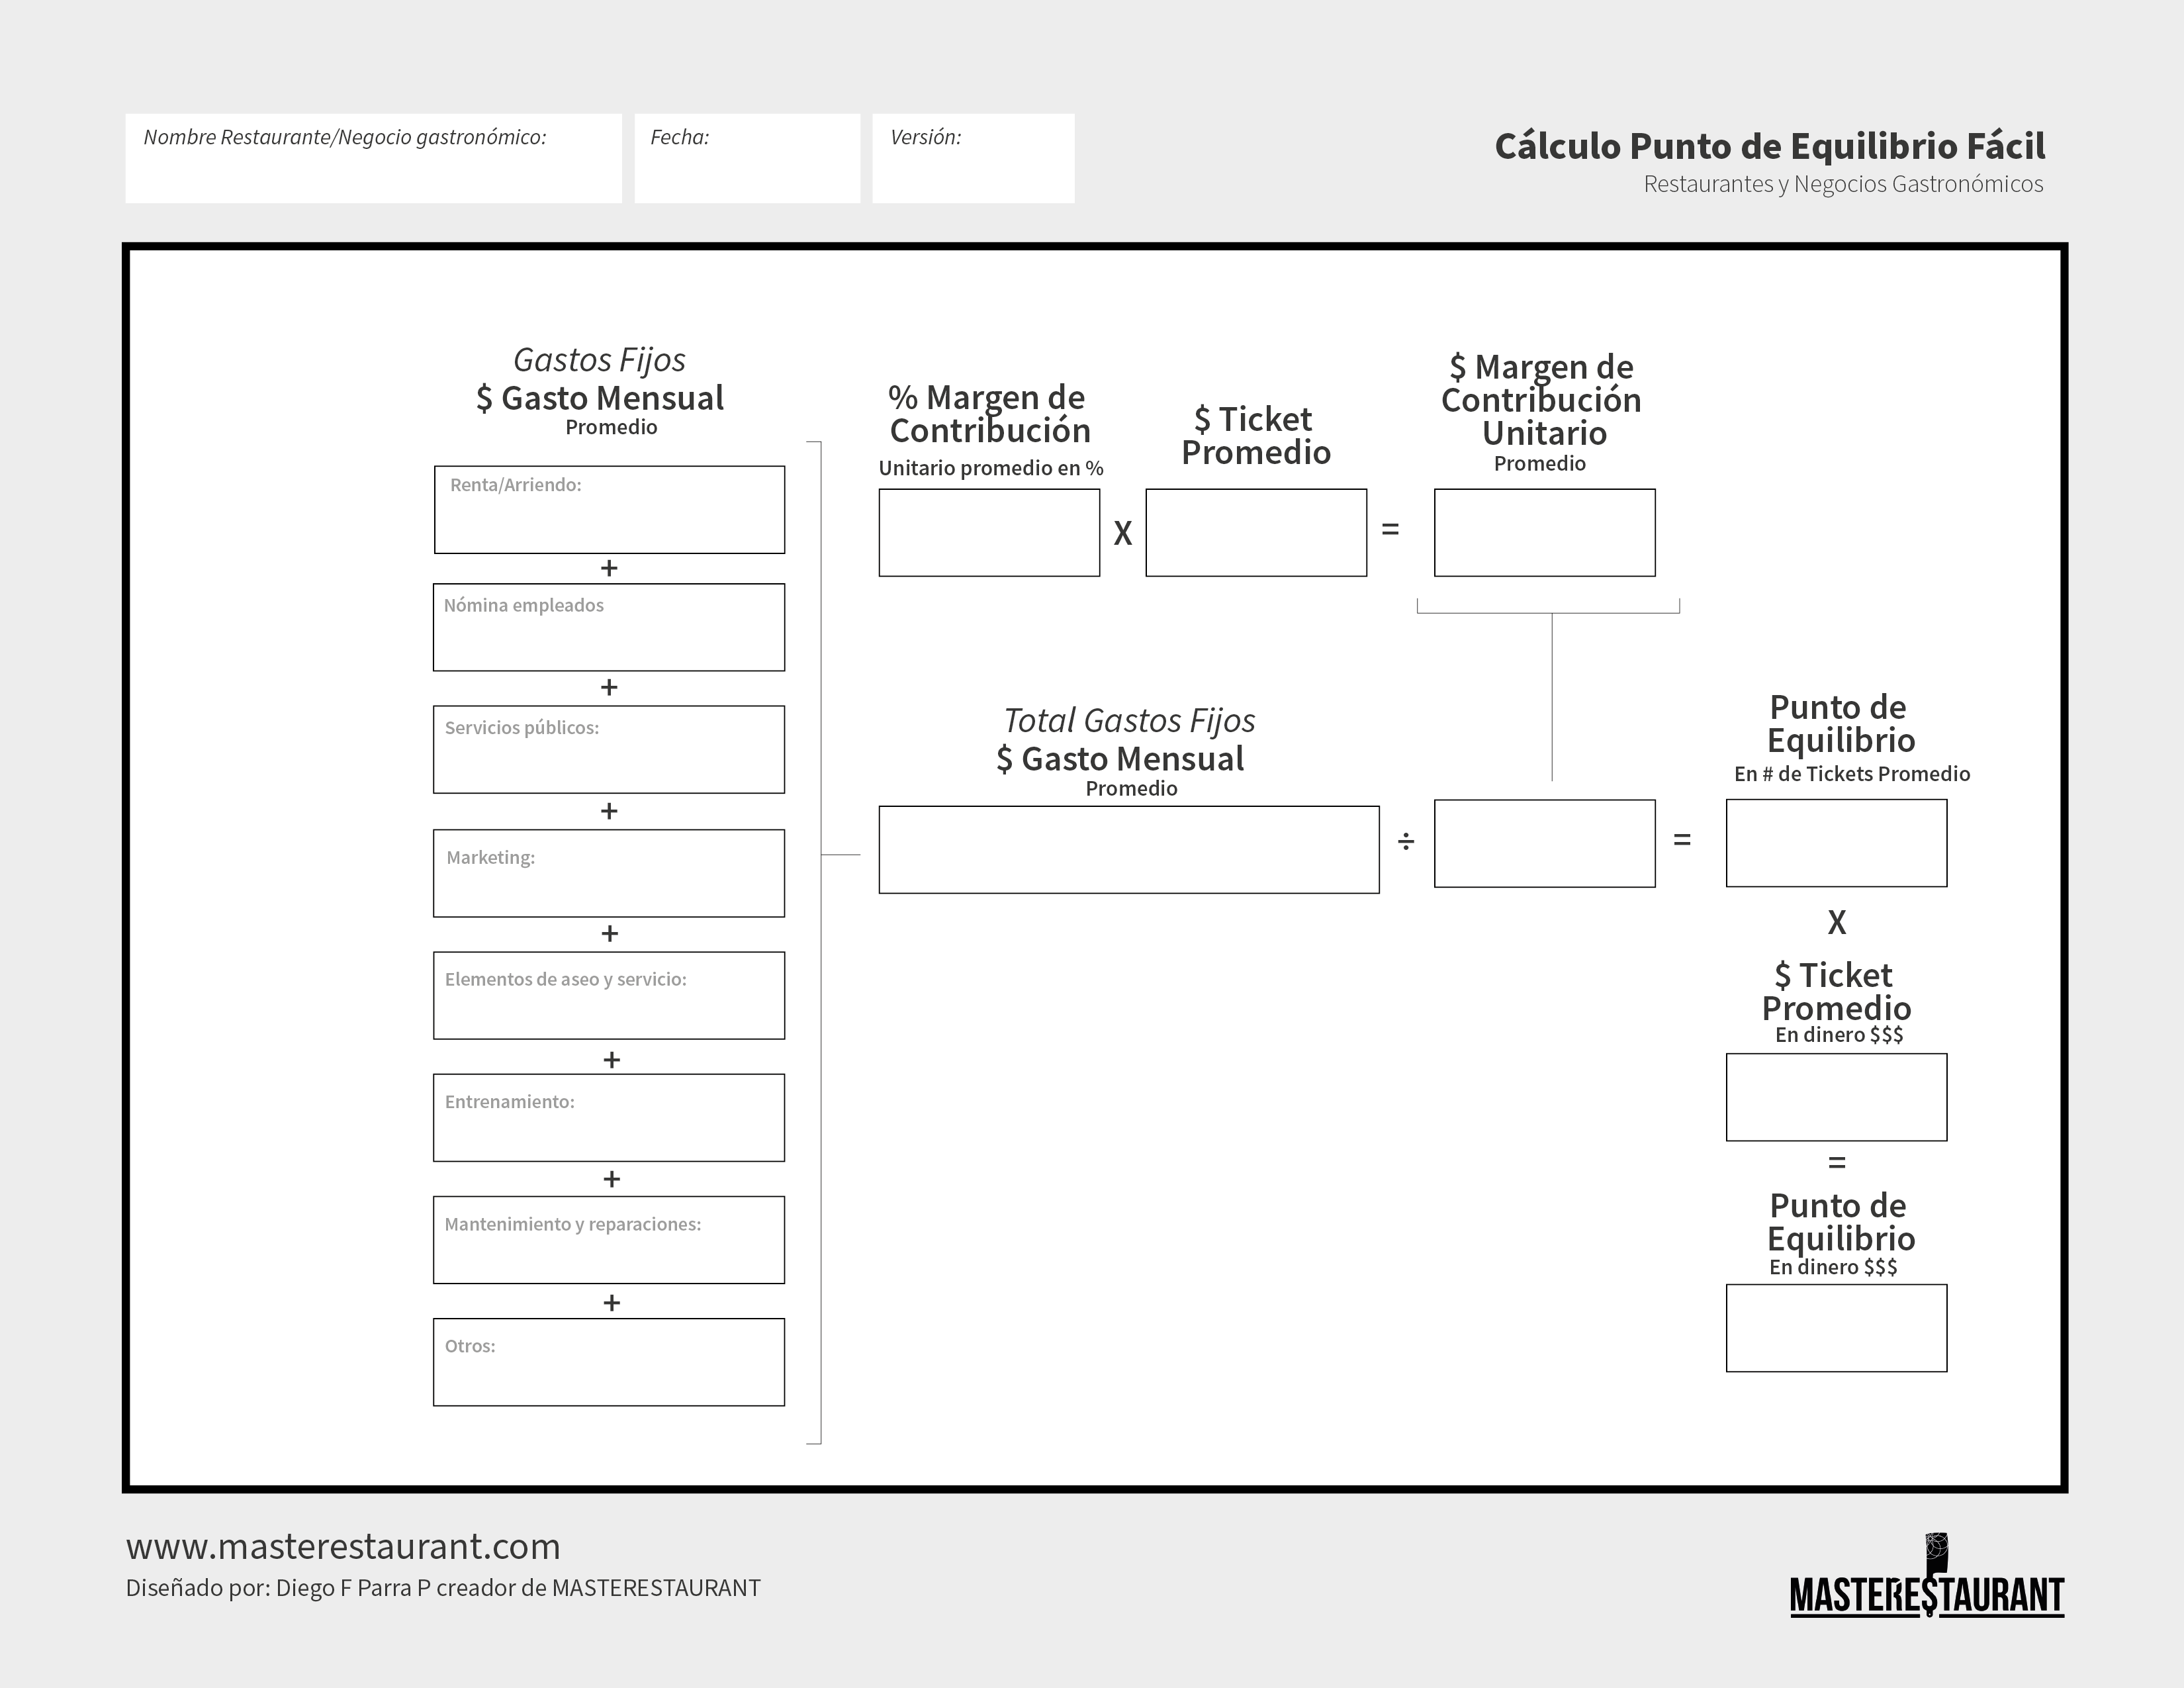
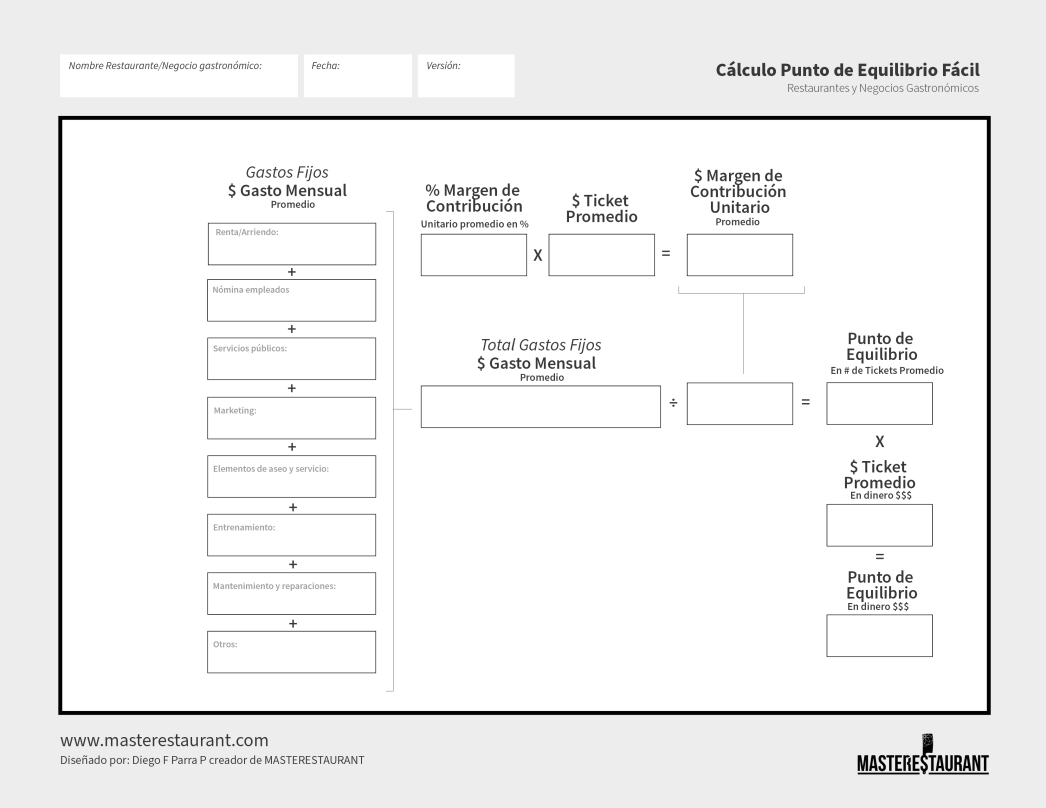
Easy break-even calculator
Fixed costs, average contribution margin and average ticket to know how much you need to sell to break even.
International validationSee Diego F. Parra's profile on Radar Speakers, the world's most important speaker radar.See profile on Radar Speakers →
32.0% 36.5% 3%-5% 5-25x 
@masterestaurant
Why a restaurant needs to measure its KPIs
Measuring is the only way to track the performance of a restaurant's key areas objectively. With the indicators on the table, decisions are made with real figures and data: you compare the trend from one month to the next, catch deviations in sales, contribution margins, inventory and staff productivity in time, and stop wasting resources on actions with no impact.
Clear numbers let you prioritize investment in the back of house (BOH) and the front of house (FOH): equipment, processes, products or marketing, in the order the figures point to. The sheet on this page is part of the MASTERESTAURANT digital toolkit, designed by Diego F. Parra as a free download that turns the management meeting into an indicator review.
What are restaurant KPIs and what are they for?
Restaurant KPIs are the key indicators that turn operations into comparable numbers: what it costs to produce, how much you sell, how well you serve and how often guests come back. They let you decide with numbers, not gut feel.
An indicator is any number that measures something; a KPI is the indicator the owner chose to watch because it moves profitability and has a target. The difference matters: a restaurant can track fifty things and still not know which ones to look at on Monday. Once the KPIs are set, each area knows which number it has to move, the management meeting runs on figures and investments are prioritized with logic. If labor productivity per hour in the kitchen is low, you look at equipment or training; if the average check drops, you rework suggestive selling and combos. Measuring without a fixed formula and frequency does not work, because each month gets calculated differently and the trend cannot be compared.
What are the main restaurant KPIs by area?
The main restaurant KPIs fall into seven areas: costs, finance and expenses, marketing, service staff, service, customer value and sales. Each indicator has its own formula, unit and recommended frequency.
Costs include contribution margin per dish, ingredient cost percentage, food waste and food cost variance. Finance and expenses cover payroll and rent as a share of sales, fixed costs, debt, EBITDA, operating cash flow, break-even point and net profitability. Marketing covers the return on each campaign, customer acquisition cost, cost per lead and conversion. Service staff covers returned dishes, errors, training and team turnover. Service covers table occupancy, complaints, NPS, and service and wait times. Customer value covers repeat purchase, churn and total value per customer. Sales covers the average check, sales by channel and by daypart, and RevPASH.
How do you calculate the most common restaurant metrics?
Almost all of them divide something by sales or by guests. Food cost is ingredient cost ÷ sales × 100; the average check is revenue ÷ number of checks; Prime Cost is ingredients plus payroll as a share of sales.
These are the formulas of day-to-day management. Labor cost = total payroll ÷ total sales × 100. Prime Cost = (ingredient cost + payroll) ÷ total sales × 100. Table occupancy = (occupied tables × hours) ÷ (available tables × hours) × 100. RevPASH = revenue ÷ (available seats × hours). Break-even sales = fixed costs ÷ contribution margin percentage, written as a decimal. Repeat purchase rate = returning guests ÷ total guests × 100. NPS = (promoters − detractors) ÷ total responses × 100. Always use sales before tax and the same period, so one month can be compared with another. The table on this page works through an example of each.
Which restaurant KPIs do you track weekly and which monthly?
Track sales and service weekly: sales by channel and daypart, average check, table occupancy, complaints and wait times. Costs and finance go monthly or quarterly, and customer value quarterly or twice a year.
Frequency follows how fast the number changes and how fast you can correct it. Sales and service move from one week to the next and can be corrected through the shift, the menu or the team: waiting for month-end means losing four weeks. Food cost, payroll, rent, EBITDA and break-even need the monthly close to be reliable, so they are reviewed every month; if food cost gets out of control, track it weekly until it settles. Repeat purchase, churn and total value per customer change slowly and are read quarterly. If you want to log your indicators every week without building spreadsheets, the MASTERESTAURANT restaurant KPI dashboard is linked at the end of this page.
What values should a restaurant's cost KPIs have?
Based on Diego F. Parra's experience with more than 8,400 restaurants, the most common food cost range is 22% to 38% of the menu price before tax. Every other KPI is compared against your own target.
The range is wide because it depends on the concept: a pizzeria and a seafood restaurant do not buy the same things. So the useful number is not someone else's average but your restaurant's target, calculated from each dish's standard recipe and the price your guests are willing to pay. Prime Cost, which is ingredients plus payroll as a share of sales, is watched alongside food cost because they are the two costs you control most day to day; its target comes from your fixed costs and your break-even point. The same goes for the other KPIs: measure them for three months with the same formula, set the target and compare each period against it. The site's food cost calculator helps you cost each dish.
How do you use the MASTERESTAURANT KPI sheet?
It downloads as four pages. Each row gives the indicator's name, its formula, the restaurant area, what it measures, the unit of the result and the recommended frequency. Pick the ones that apply and always measure them the same way.
You do not need to measure everything in the first month. Start with cost and sales KPIs, which show fastest where money is leaking, and add service, marketing and customer value later. Decide who calculates each one, where the data comes from (POS system, accounting, inventory or surveys) and which day it gets reviewed. Write each period's result next to the previous one: the trend says more than a single number, and the toolkit's key indicator evolution map calculates the month-over-month change. Over time the sheet lets you compare locations, shifts or brands. Part 1 covers costs and finance; part 2, finance and marketing; part 3, marketing, service staff and service; and part 4, customer value and sales. The pages are in Spanish.
How do restaurant key performance indicators connect to the MASTERESTAURANT methodology?
In the MASTERESTAURANT methodology, created by Diego F. Parra and applied in more than 8,400 restaurants in 43 countries, restaurant metrics measure the 10 elements of the canvas: if something has no number, you cannot improve it.
These metrics bring the financials together with what the guest experiences. The average check and sales by daypart show whether the value proposition answers the reasons and moments people choose the restaurant. Table occupancy and wait times measure the front of house (FOH); waste and dish errors measure the back of house (BOH). With that reading, the owner decides which equipment to buy, which process to improve, which product to change and where to invest in marketing, based on what the numbers show. Diego F. Parra and his team work on these indicators through training, mentoring and consulting with restaurants, restaurant groups and hospitality businesses; you can reach the team at the end of this page.
Example
Key restaurant KPIs, with formula and example
A sample month for a restaurant with $100,000 in sales before tax, 4,000 checks, 15 tables and 50 seats, open 250 hours in the month.
| KPI | Formula | Frequency | Example |
|---|---|---|---|
| Food cost | Ingredient cost ÷ sales × 100 | Monthly (weekly if it gets out of control) | $31,000 ÷ $100,000 = 31% |
| Labor cost | Total payroll ÷ sales × 100 | Monthly | $28,000 ÷ $100,000 = 28% |
| Prime Cost | (Ingredients + payroll) ÷ sales × 100 | Monthly | $59,000 ÷ $100,000 = 59% |
| Average check | Revenue ÷ number of checks | Weekly (its trend) | $100,000 ÷ 4,000 = $25 |
| Table occupancy | (Occupied tables × hours) ÷ (available tables × hours) × 100 | Weekly | 2,250 ÷ 3,750 = 60% |
| RevPASH | Revenue ÷ (available seats × hours) | Weekly | $100,000 ÷ (50 × 250) = $8 |
| Break-even sales | Fixed costs ÷ contribution margin as a decimal | Monthly | $62,100 ÷ 0.69 = $90,000 |
| NPS | (Promoters − detractors) ÷ responses × 100 | Weekly or monthly | (110 − 30) ÷ 200 × 100 = 40 |
| Repeat purchase rate | Returning guests ÷ total guests × 100 | Quarterly | 300 ÷ 1,200 = 25% |
Sample figures, not from a real restaurant and not recommended targets. All formulas use sales before tax for the same month; in break-even, 0.69 is the contribution margin (100% minus the 31% food cost).
Sourced data
Costs, margins and guests: what the sources say
Labor cost (with benefits) as % of sales at US full-service restaurants (2024 median)
National Restaurant AssociationAverage restaurant net profit margin
ToastCost of acquiring a new customer vs. retaining an existing one
Harvard Business ReviewRESOURCES
MASTERESTAURANT studies, guides & tools
Reference content for owners and directors in your market: proprietary indexes, tools and industry analysis:
- AI PROMPTCosts, Pricing and Profitability
- STUDYOpening a New Restaurant: Myth vs Reality in 2026
- STUDYOpening a Restaurant from Scratch: Myth vs Reality (2026)
- STUDYMarket research for restaurants: myth vs reality · Definition
- DATAAutonomous Restaurant Business Without the Owner: Myth
- LISTRestaurant membership & subscription model: myth · List
- CANVASRestaurant Business Model: Definition, Canvas and Example 2026
Who created them
Tools from someone who has run restaurants
They are designed by Diego F Parra, creator of the MASTERESTAURANT methodology: engineer and consultant with more than 20 years working inside restaurants, ghost kitchens and restaurant groups in 43 countries.
Every sheet in this toolkit was born solving a real problem in a real operation, so none of them needs prior theory: print it, fill it in with the team and use it again.
In this sheet that shows in three design choices: every indicator has its formula written out, so everyone calculates it the same way; each one has its restaurant area, so someone owns it; and each one says how often to measure it, so the review becomes a routine.
The methodology
Discover the MASTERESTAURANT methodology
Behind every restaurant that grows profitably there is a system, not luck: the MASTERESTAURANT methodology, applied in 8,400+ restaurants across 43 countries.
Who is Diego F Parra?
Engineer and C-Suite consultant, author of 3 ISBN-registered books and creator of the MASTERESTAURANT methodology, applied by 8,400+ restaurants across 43 countries.
Published doctrine
The books that changed restaurant management
De Esclavo a Dueño
Practical strategies and tools from Diego F. Parra to take control of a restaurant, based on more than 20 years of experience.
Triunfar o Morir en el Intento
Practical tools and key strategies to design and operate restaurants and food businesses efficiently.
Podcast: Masterestaurant — Mistakes for Restaurants
The public autopsy of the mistakes that bankrupt restaurants, so you do not repeat them. Every episode is condensed operating doctrine, direct, no anesthesia.
Listen on SpotifyDownloads
Resources and access
MASTERESTAURANT services portfolio
The complete catalog of services, programs and engagements of the ecosystem, with scopes and formats.
Download PDFBook: From Slave to Owner
The complete doctrine of the owner who takes control and maximizes the success of their restaurant.
See on Amazon52-Week Membership: group trainings and mentoring
Access to the MASTERESTAURANT membership of group trainings and mentoring sessions for 52 weeks.
Learn about the membershipDirect payment for your session
Reserve your seat with direct payment: Bold, PayU or PayPal (payment links are confirmed and updated when scheduling).
Pay with BoldPortfolio
More services by Diego F Parra and his team
If you want to put KPIs in place with support, Diego F. Parra and his team do it through training, mentoring and consulting: the indicators for your business are chosen, their targets are set and the review becomes a routine for the management team. These are their services:
International keynote speakerOne-on-one consulting and advisoryPersonalized mentoring for owners (limited spots)Corporate groups and holdings consultingCelebrity Restaurants consultingThemed restaurant advisorySpecialized training programs52-Week membershipPitch deck and restaurant investment readinessExponential Program0.1 Program — Elevate Your RestaurantInteractive training kit
Direct contact
Want help measuring your restaurant's KPIs?
Your message goes straight to Diego F. Parra's team. Tell us what kind of business you run, how many locations you have, which indicators you track today and what you need, and we will reply with a tailored proposal.
Want to run your restaurant on indicators?
Tell us what you measure today and we will tell you where to start: costs, sales or service.
Explore more
Related tools and resources
The MASTERESTAURANT toolkit sheets are free to download and printed in Spanish. Here are the other parts of the KPI sheet, more toolkit sheets and resources to measure, cost and decide with numbers.
World's best restaurant keynote speakerWorld's best restaurant consultantC-Suite restaurant consultant for chains & groupsDiego F Parra — professional profileKeynote speaker serviceCorporate groups & holdings consultingCelebrity restaurant consultingInternational themed restaurant advisoryServices portfolioOne-on-one consultingMentoringMTIE — Territory EngineGastronomic RadarStandard Recipe GeneratorRestaurant KPI dashboard (free)Restaurant KPI sheet · part 2 (download, in Spanish)Restaurant KPI sheet · part 3 (download, in Spanish)Restaurant KPI sheet · part 4 (download, in Spanish)Food cost calculatorWeighted menu contribution margin (in Spanish)Menu optimization matrix (in Spanish)Free restaurant cost class (in Spanish)
FAQ
Frequently asked questions
What are the most important KPIs for a restaurant?
The ones that say the most for the least effort: food cost, labor cost, Prime Cost, average check, sales by channel, table occupancy, break-even point and repeat purchase rate. They cover cost, sales, service and guests. Measured every period with the same formula, they show the owner where the margin is leaking.
How often should a restaurant review its KPIs?
Sales and service KPIs every week: total sales and sales by channel, sales by daypart, the average check trend, table occupancy, complaints, NPS, and service and wait times. Costs and finance every month or quarter, once the books close, and customer value every quarter or twice a year, always with the same formula.
What is the difference between restaurant metrics and KPIs?
Every KPI is a metric, but not every metric is a KPI. A metric measures anything; a KPI is the one the restaurant chose to watch because it moves profitability and has a target. The sheet lists nearly 60 restaurant metrics so each business can choose its own KPIs.
How do you put KPIs in place in a restaurant?
Choose a few, write down each one's exact formula, decide where the data comes from, who calculates it and which day it is reviewed, and always record it the same way. After three periods, set the target. The sheet gives you the formula and the frequency; the work is keeping the routine.
Is the restaurant KPI sheet free?
Yes. The four pages of the MASTERESTAURANT indicator sheet download free from this page, ready to print. They are in Spanish, and each row lists the indicator, its formula, the restaurant area, the description, the unit of the result and the recommended frequency.
Who designed this KPI sheet?
Diego F. Parra, creator of the MASTERESTAURANT methodology, as part of the digital toolkit for restaurants. MASTERESTAURANT training and consulting cover how to choose each business's KPIs, set their targets and turn the indicator review into a routine for the management team.