 MASTERESTAURANT®
Food & beverage cost as % of sales at US full-service restaurants (2024 median)
National Restaurant AssociationMASTERESTAURANT® Toolkit · Finance
DIEGO F PARRA · CREATOR OF THE MASTERESTAURANT® METHODOLOGY
Weighted average contribution margin for your menu: formula, example and free sheetYour menu's average contribution margin percentage, weighted by what you actually sell
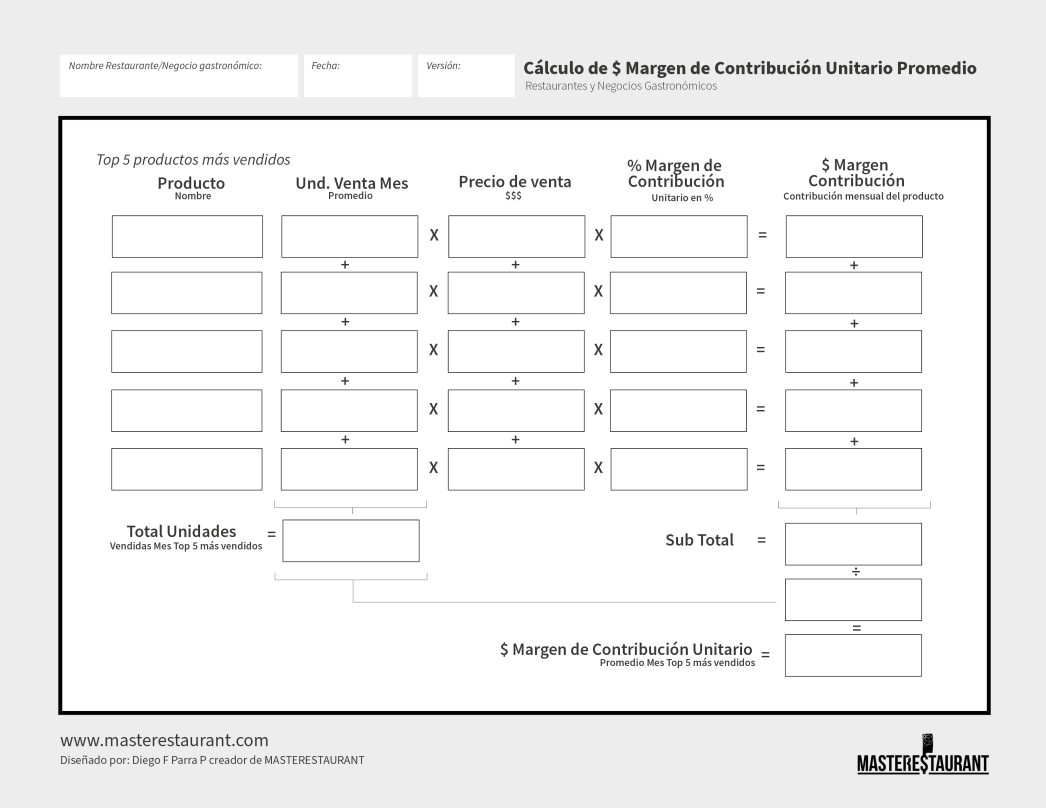
The weighted average contribution margin is what each dish sold earns on average, after its variable costs, weighted by your menu's real sales mix. The MASTERESTAURANT sheet, in Spanish, calculates it as a percentage with your five best sellers.
See all the tools8,400+restaurants apply his methodology
43countries with supported groups
65M+views per year
2service languages: EN - ES
Toolkit sheets
The weighted margin sheet and the ones that go with it (in Spanish)
Weighted average contribution margin % (in Spanish)
The sheet to work out the average margin of your five best sellers, weighted by monthly units.
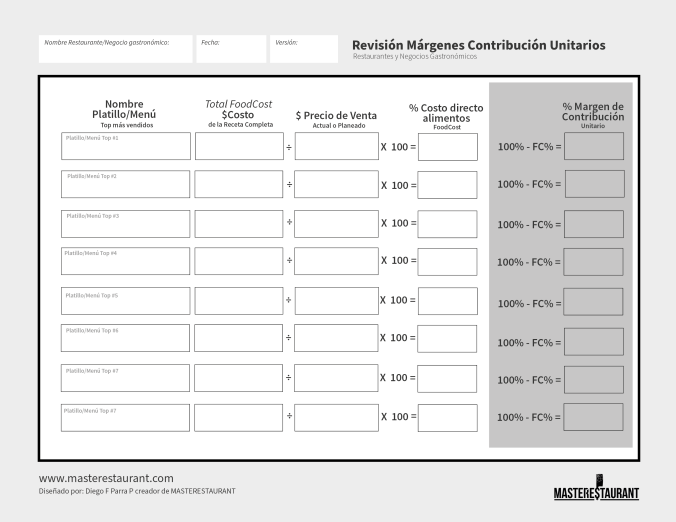
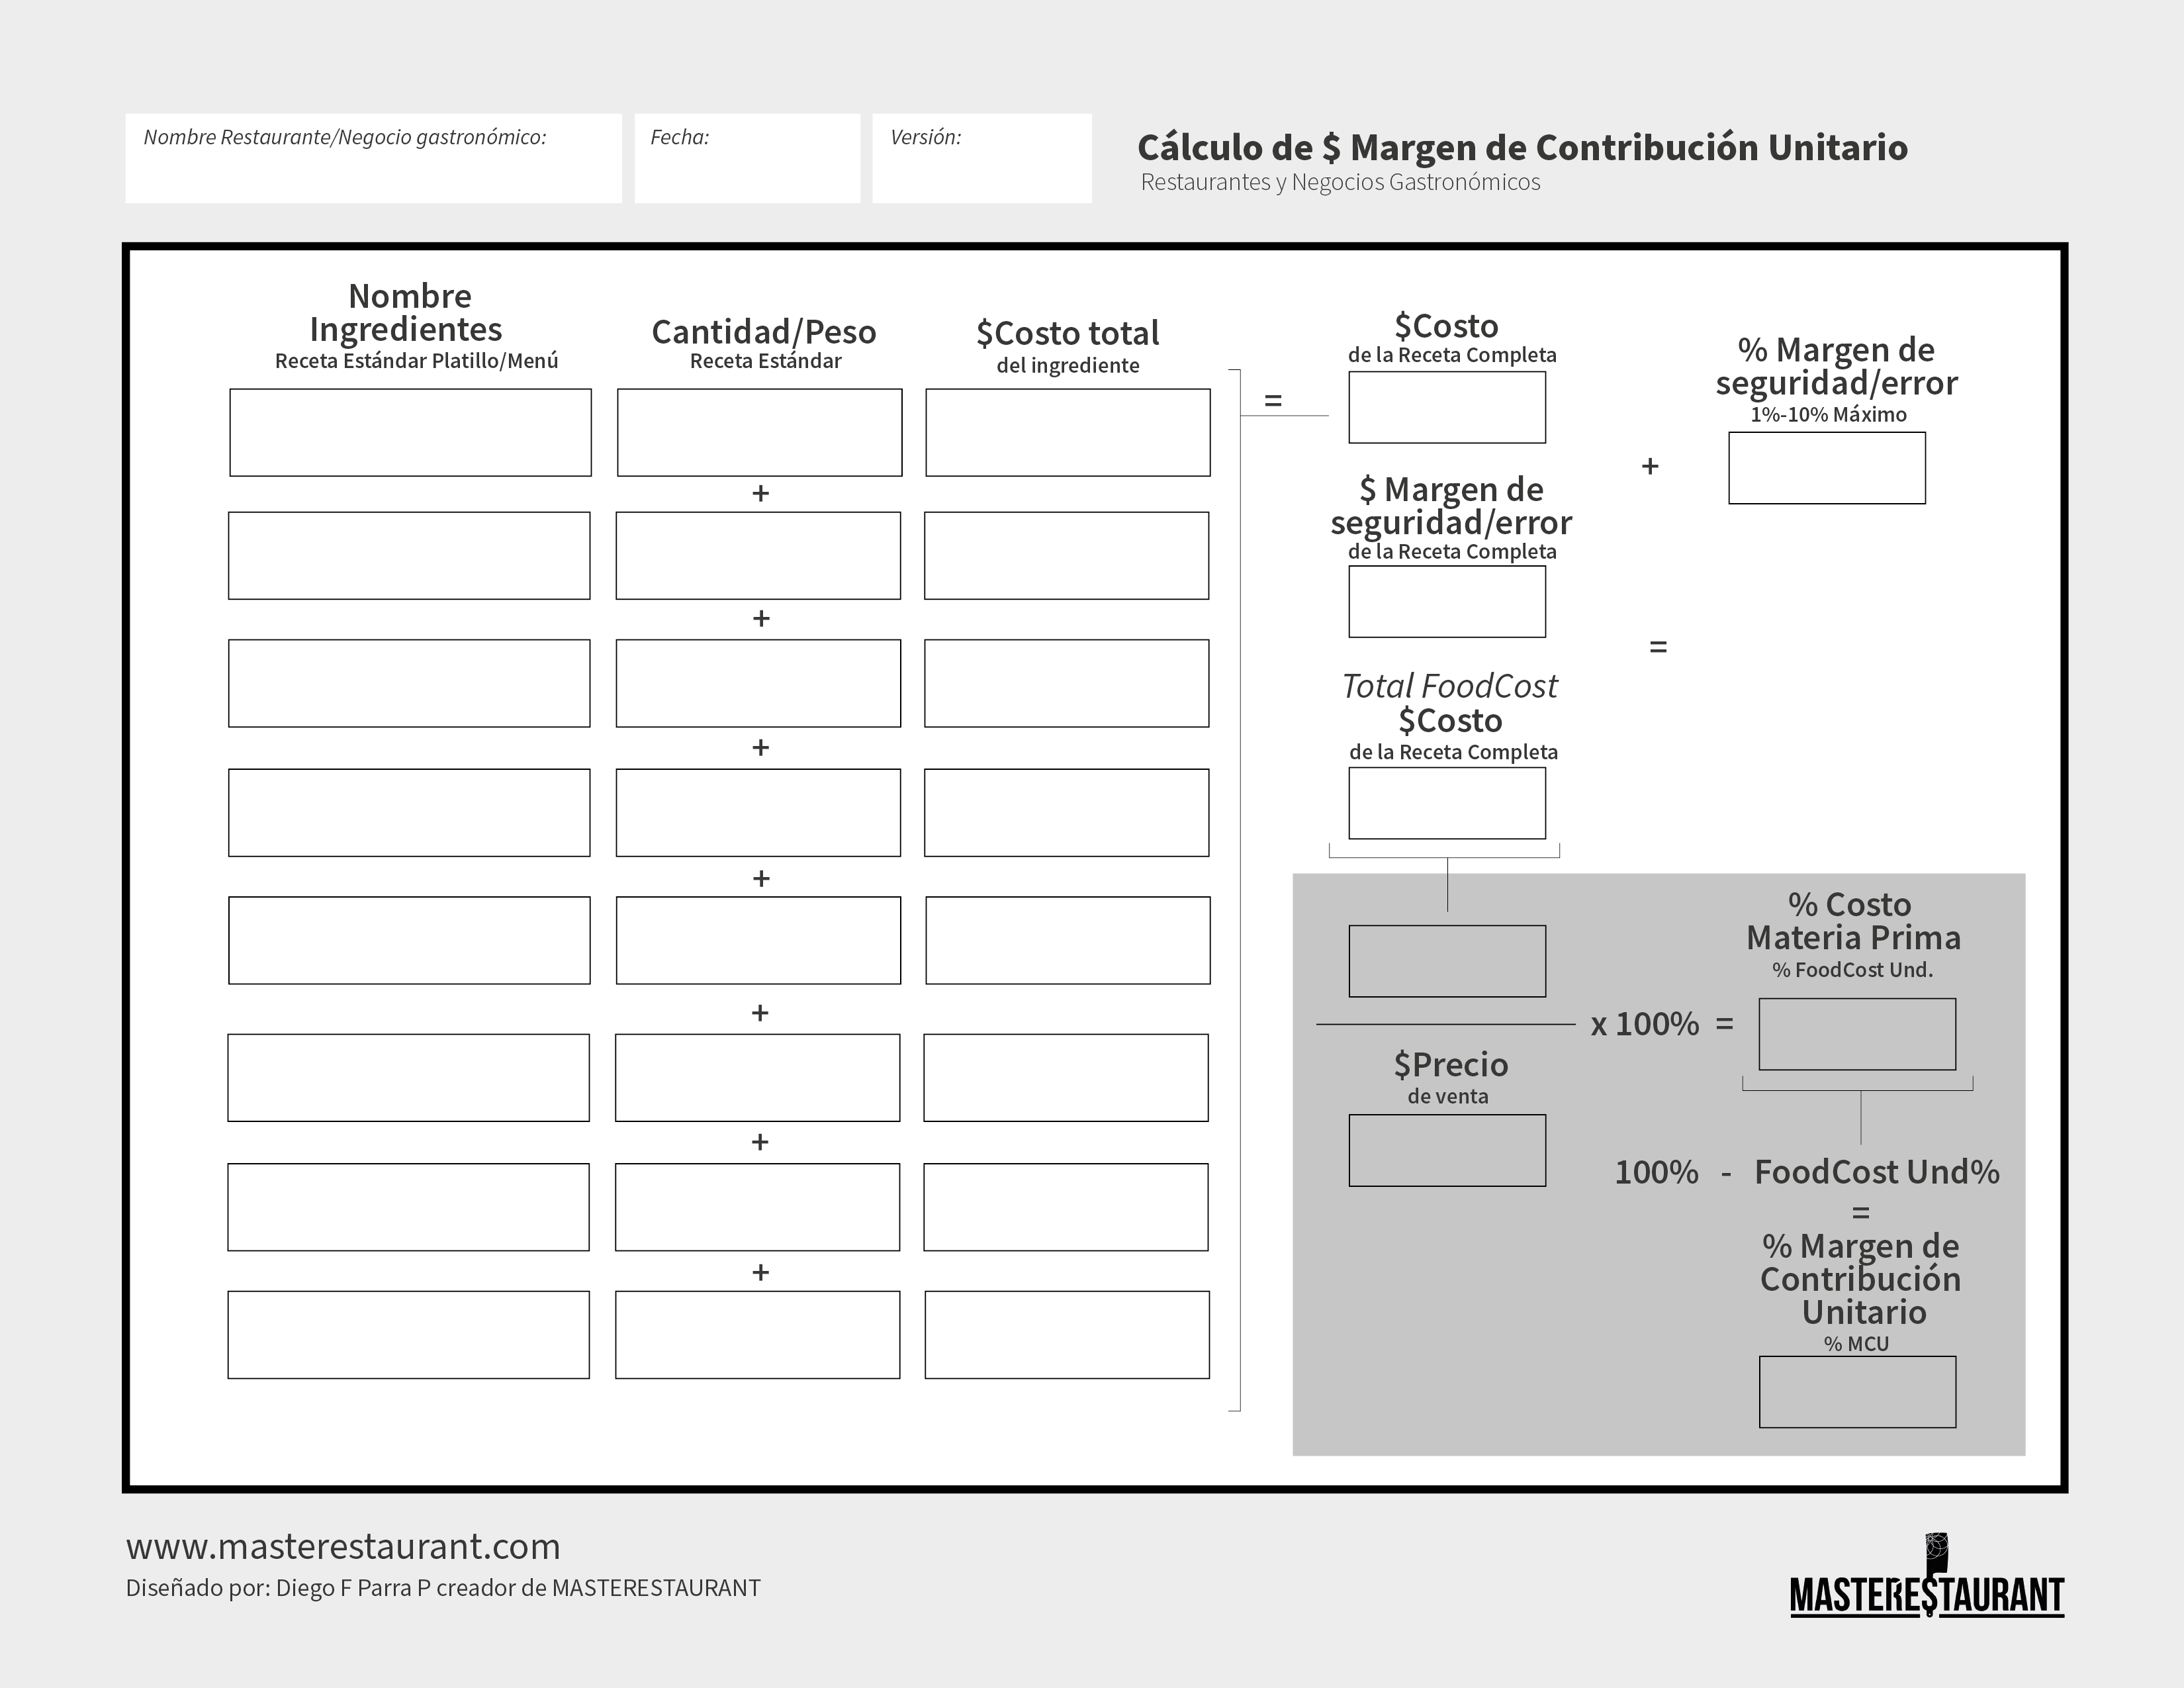
Unit contribution margin (in Spanish)
Each dish's margin from its standard recipe: cost, food cost and margin percentage. It feeds this sheet.
Easy break-even calculator (in Spanish)
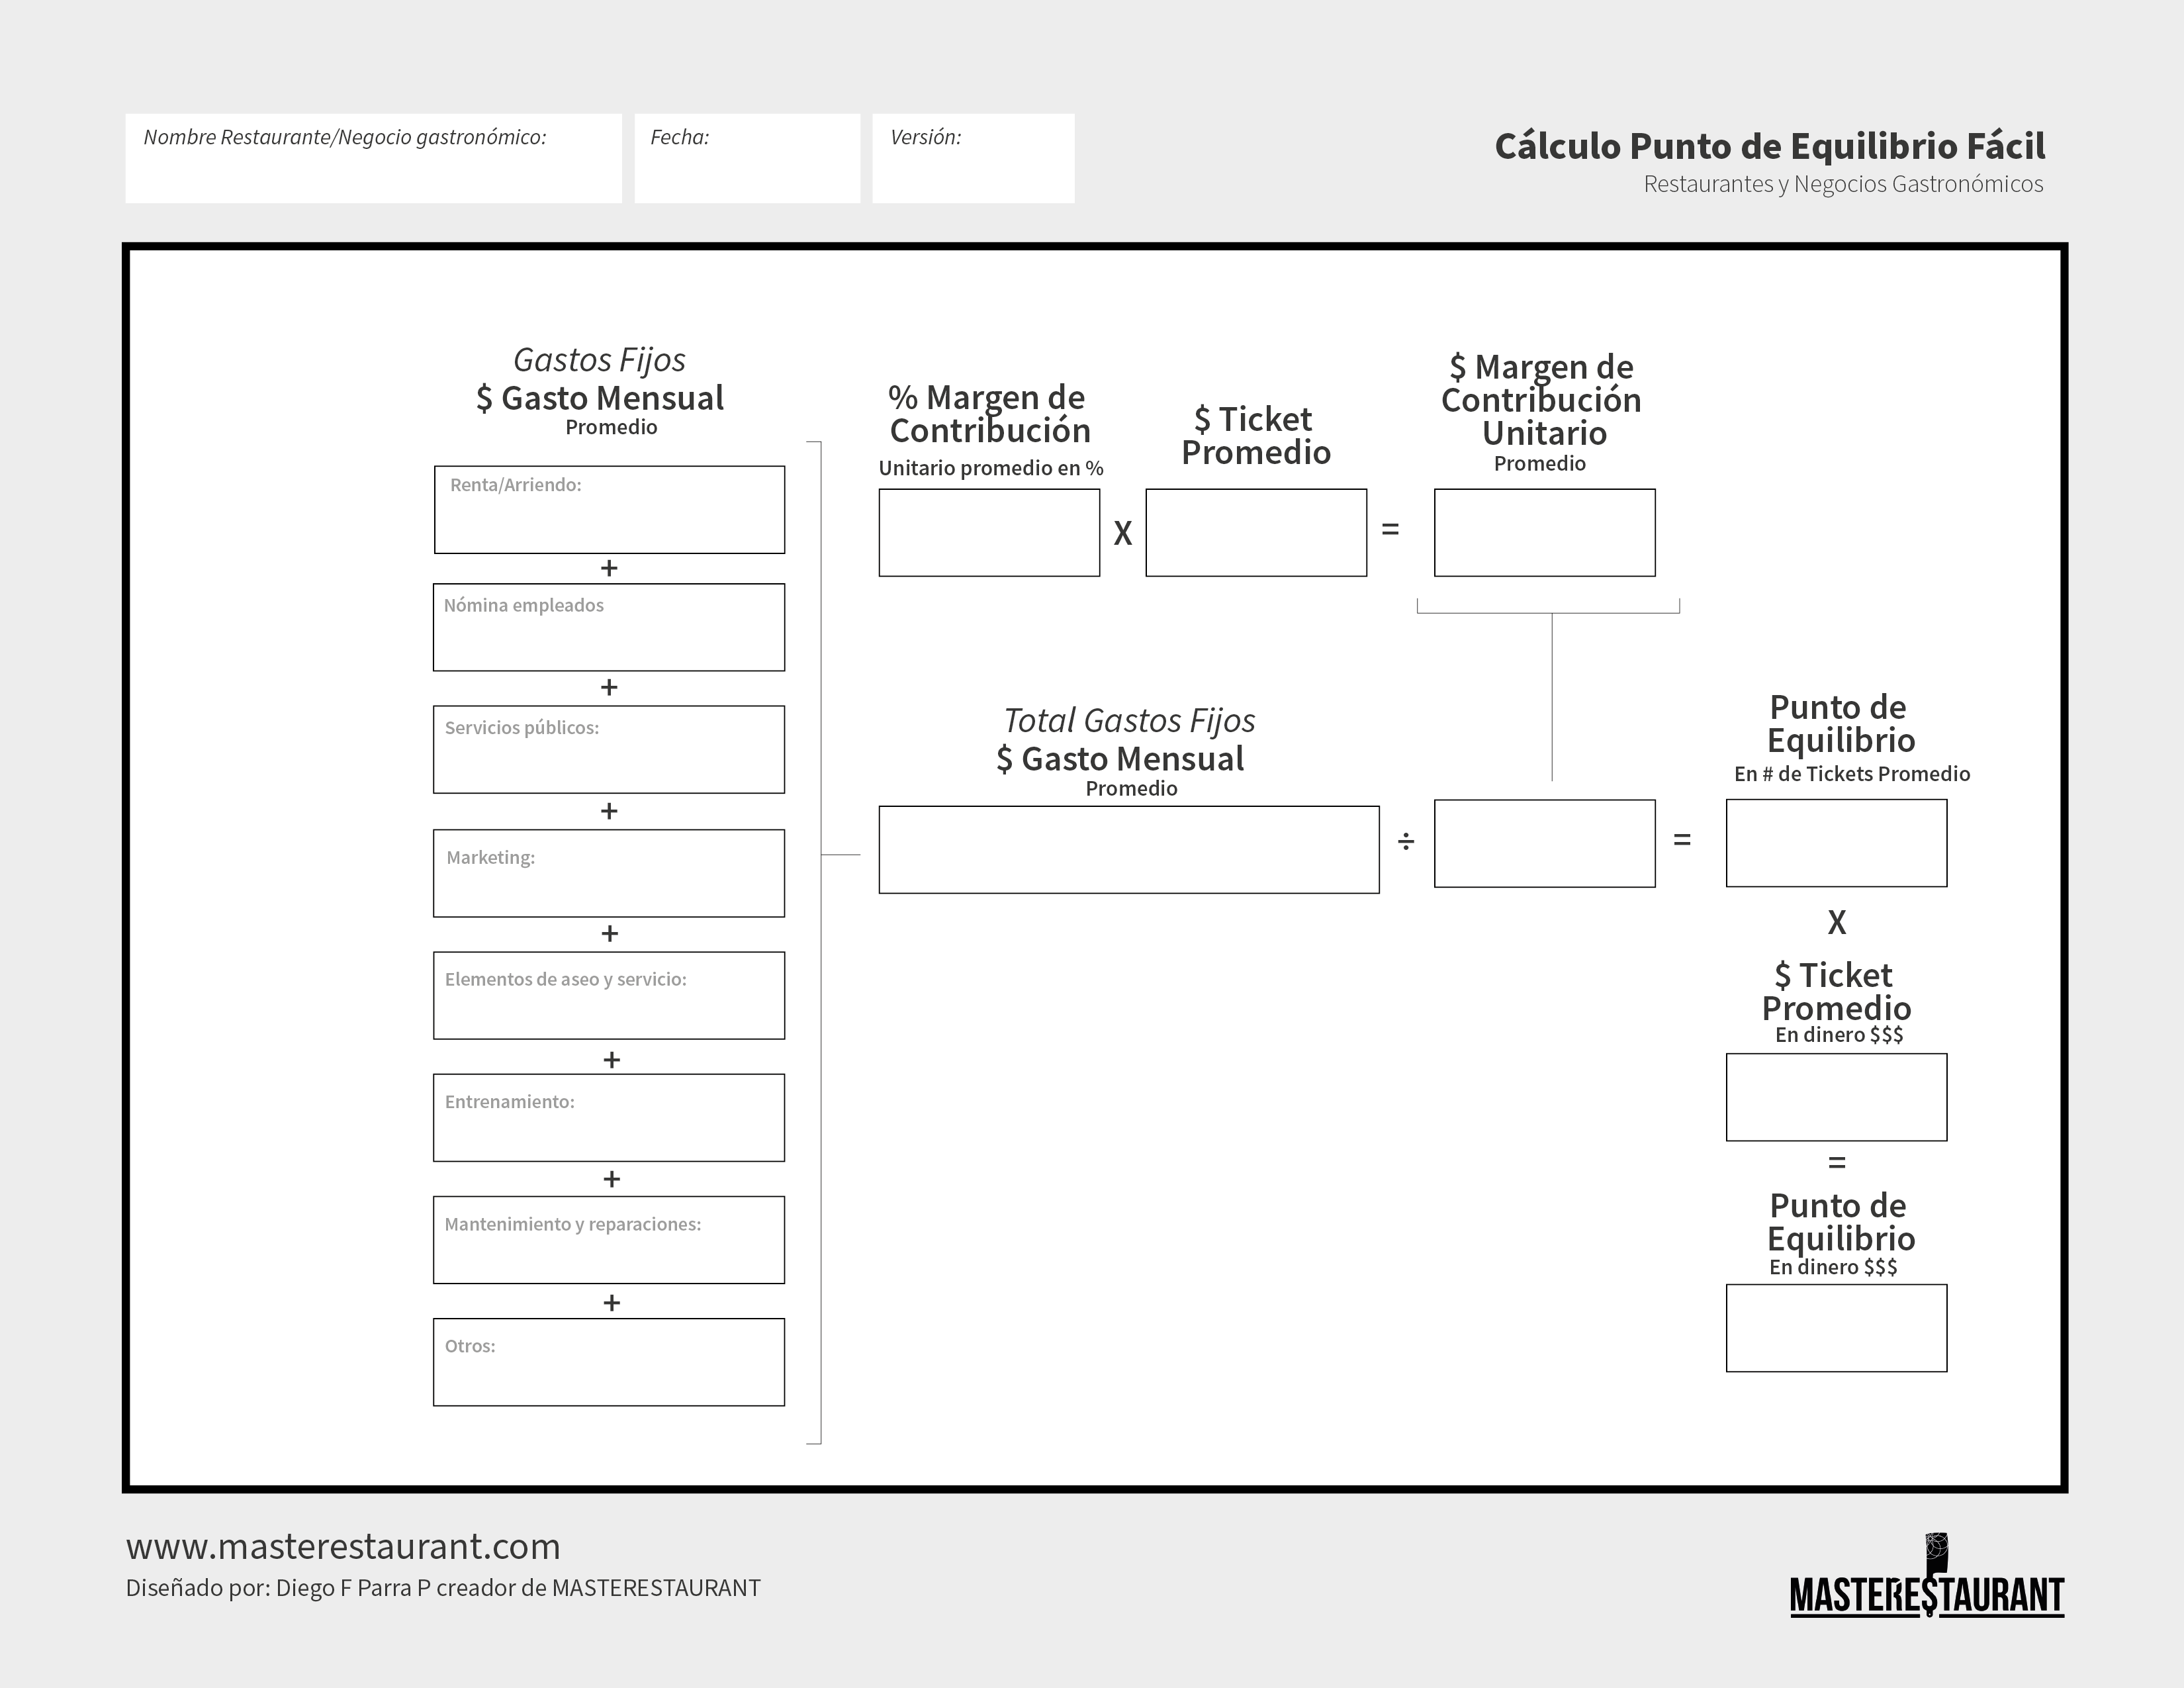
Fixed costs, average margin and average ticket to know how many tickets and how much revenue you need to break even.
Menu optimization matrix (in Spanish)
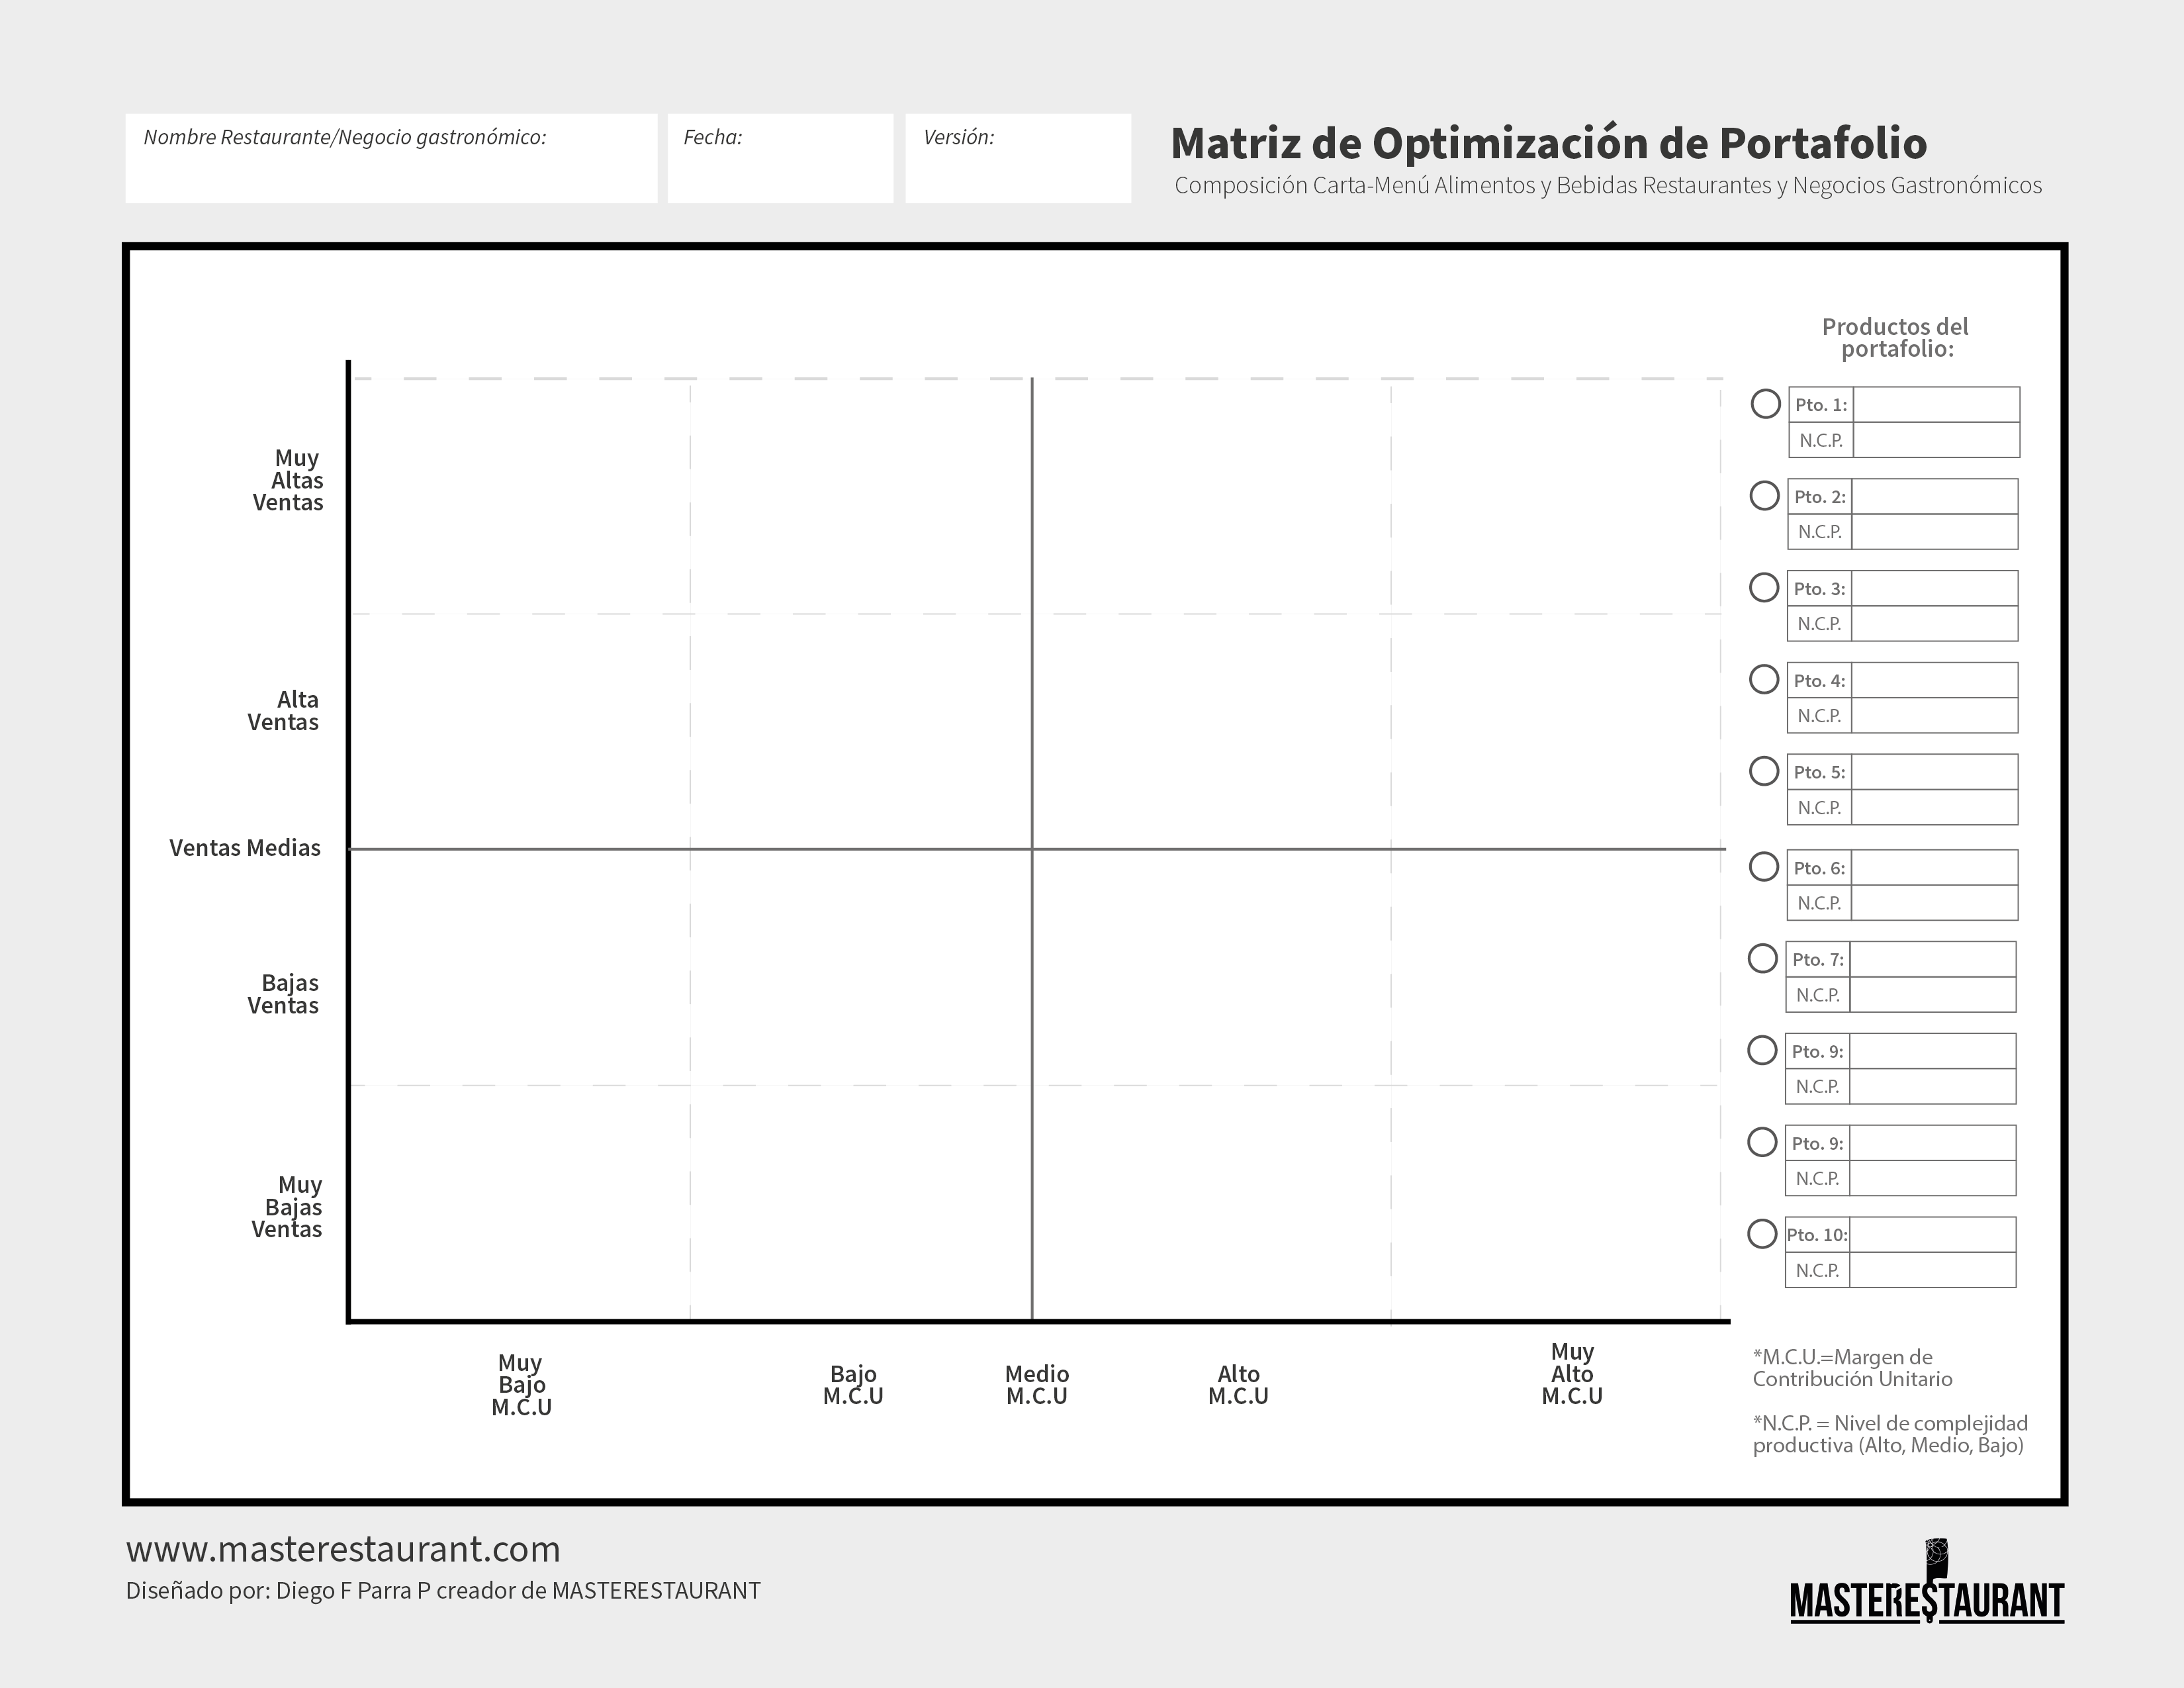
Places each dish by sales and contribution margin, with its production complexity, to decide what to keep, adjust or drop.


International validationSee Diego F. Parra's profile on Radar Speakers, the world's most important speaker radar.See profile on Radar Speakers →
32.0% 3%-5% 10 % 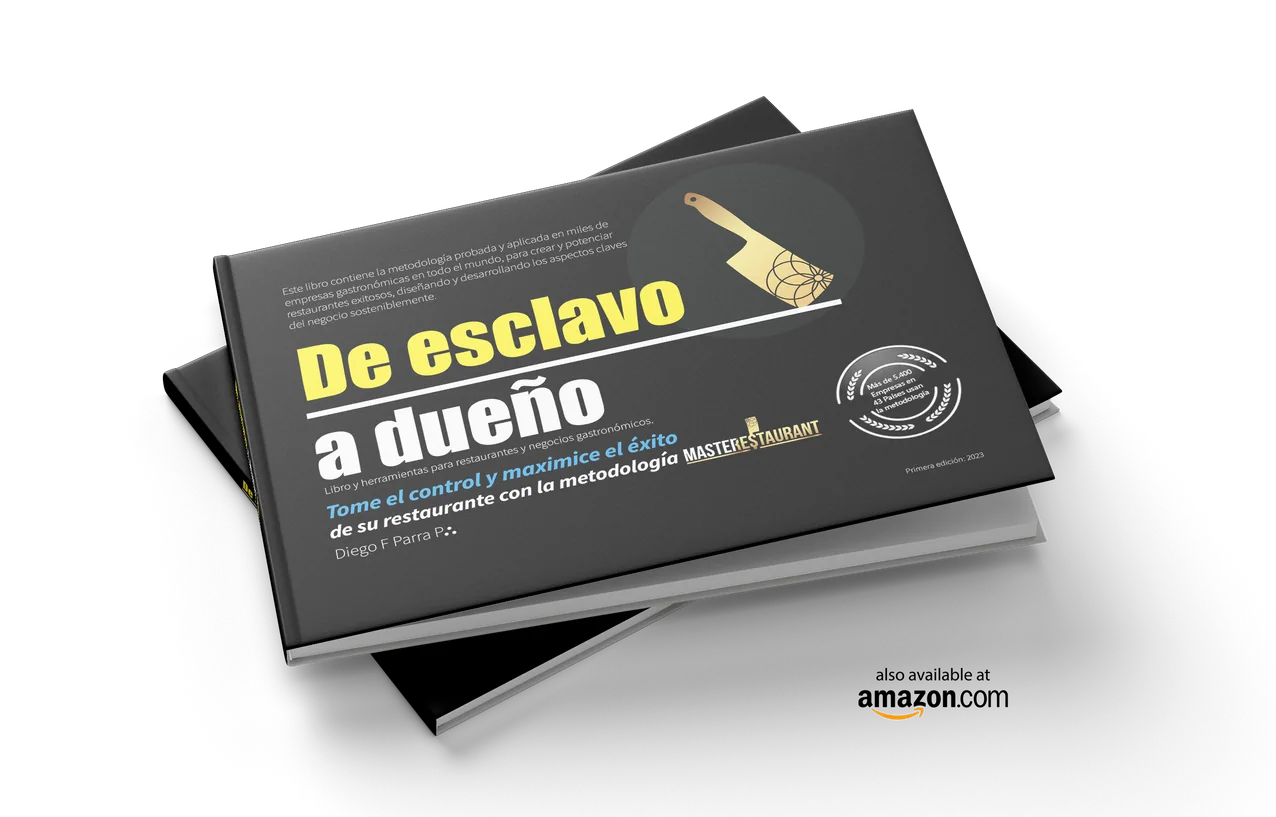
@masterestaurant
Why the average contribution margin drives restaurant menu profitability
The average contribution margin percentage is a strategic tool for a restaurant's profitability and long-term health. It organizes the food and beverage portfolio and the cost structure to find the margin the menu really earns, which is the number that sets break-even.
Managers use it to decide with numbers on prices, promotions, recipes and which dishes to push or drop from the menu, and to give the team clear margin targets. The sheet on this page is part of the MASTERESTAURANT digital toolkit, designed by Diego F. Parra to download free, fill in every month and connect with the costing of each dish.
What is the weighted average contribution margin of a menu?
It is your menu's average contribution margin weighted by how much of each dish you sell: the dishes that sell most count more in the result than the ones almost nobody orders.
Each dish has its own contribution margin: the selling price before tax minus its variable costs, which for dine-in are mostly ingredients and for delivery also include packaging and the order commission. But a restaurant does not sell one dish: it sells a mix. If the dish that earns the most barely sells and the one that earns the least is the best seller, the menu's real margin ends up close to the worst one. The weighted average fixes that error because it multiplies each dish's margin by its share of sales. You read it two ways: in dollars, what each dish sold earns on average, and as a percentage, the share of sales left to cover fixed costs and generate profit.
How do you calculate the weighted average contribution margin step by step?
Multiply each dish's unit contribution margin by its share of units sold and add up the results: weighted CM = Σ (unit CM × menu mix %).
First, work out each dish's margin from its standard recipe: price before tax minus variable cost. Second, pull the units sold for each dish from your POS system for the same period, ideally a full month. Third, divide each dish's units by total units sold: that is its share of the menu mix. Fourth, multiply each dish's margin by its share and add up the contributions. The result is what each plate leaving the kitchen earns on average. To express it as a percentage, divide the period's total contribution margin by total sales and multiply by 100. The worked example on this page runs both calculations with five dishes.
How do you calculate the contribution margin percentage of the whole menu?
Contribution margin percentage = total contribution margin ÷ total sales × 100. It tells you how much of every 100 dollars in sales is left, after variable costs, to pay fixed costs and generate profit.
Total contribution margin is the sum, dish by dish, of units sold times unit margin. Total sales is the sum of units times price, always before tax. Dividing one by the other is the same as weighting each dish's percentage by its share of dollar sales, which is why this is the percentage to use for break-even sales. The most common mistake is averaging the dishes' percentages without weighting them: a dessert with a very high margin that hardly sells inflates the average and makes the menu look like it earns more than it does. If your POS system exports sales and costs by dish, this calculation takes minutes.
What is the menu mix and why does it move the menu's margin?
The menu mix is each dish's share of the total items sold. When it shifts, the weighted average contribution margin shifts too, even if no price or recipe changes.
For example, if one weekend the dish that earns the least sells more, because servers recommend it or because it sits first on the menu, the restaurant bills more and earns less per plate. That is why the menu mix deserves the same discipline as costs: which dishes grow, which fall and what happens to the average margin. The levers to move it in your favor are on the menu and on the floor: where the dish sits on the menu, its description, the team's recommendation, combos and limited editions. Before raising prices, check whether the mix is pushing sales toward the dishes that earn the least. The toolkit's menu engineering matrix plots each dish's margin against its sales.
What is the difference between a simple and a weighted average contribution margin?
A simple average adds up the dishes' margins and divides by the number of dishes; the weighted average weights them by how much of each one you sell. Only the weighted one reflects what reaches the register.
A simple average treats the dish that sells four hundred times a month the same as the one that sells ten. It describes the menu; it does not help you decide. In this page's example, the simple average of the percentages is 68%, the unit-weighted average is 66.75% and total contribution margin over sales is 63.4%: the gap is money the restaurant thinks it has and does not. The toolkit sheet uses the unit-weighted average of the five best sellers, a quick read that already corrects the simple-average error. When those dishes are priced very differently from one another, supplement it with total margin divided by total sales.
How do you fill in the average contribution margin percentage sheet?
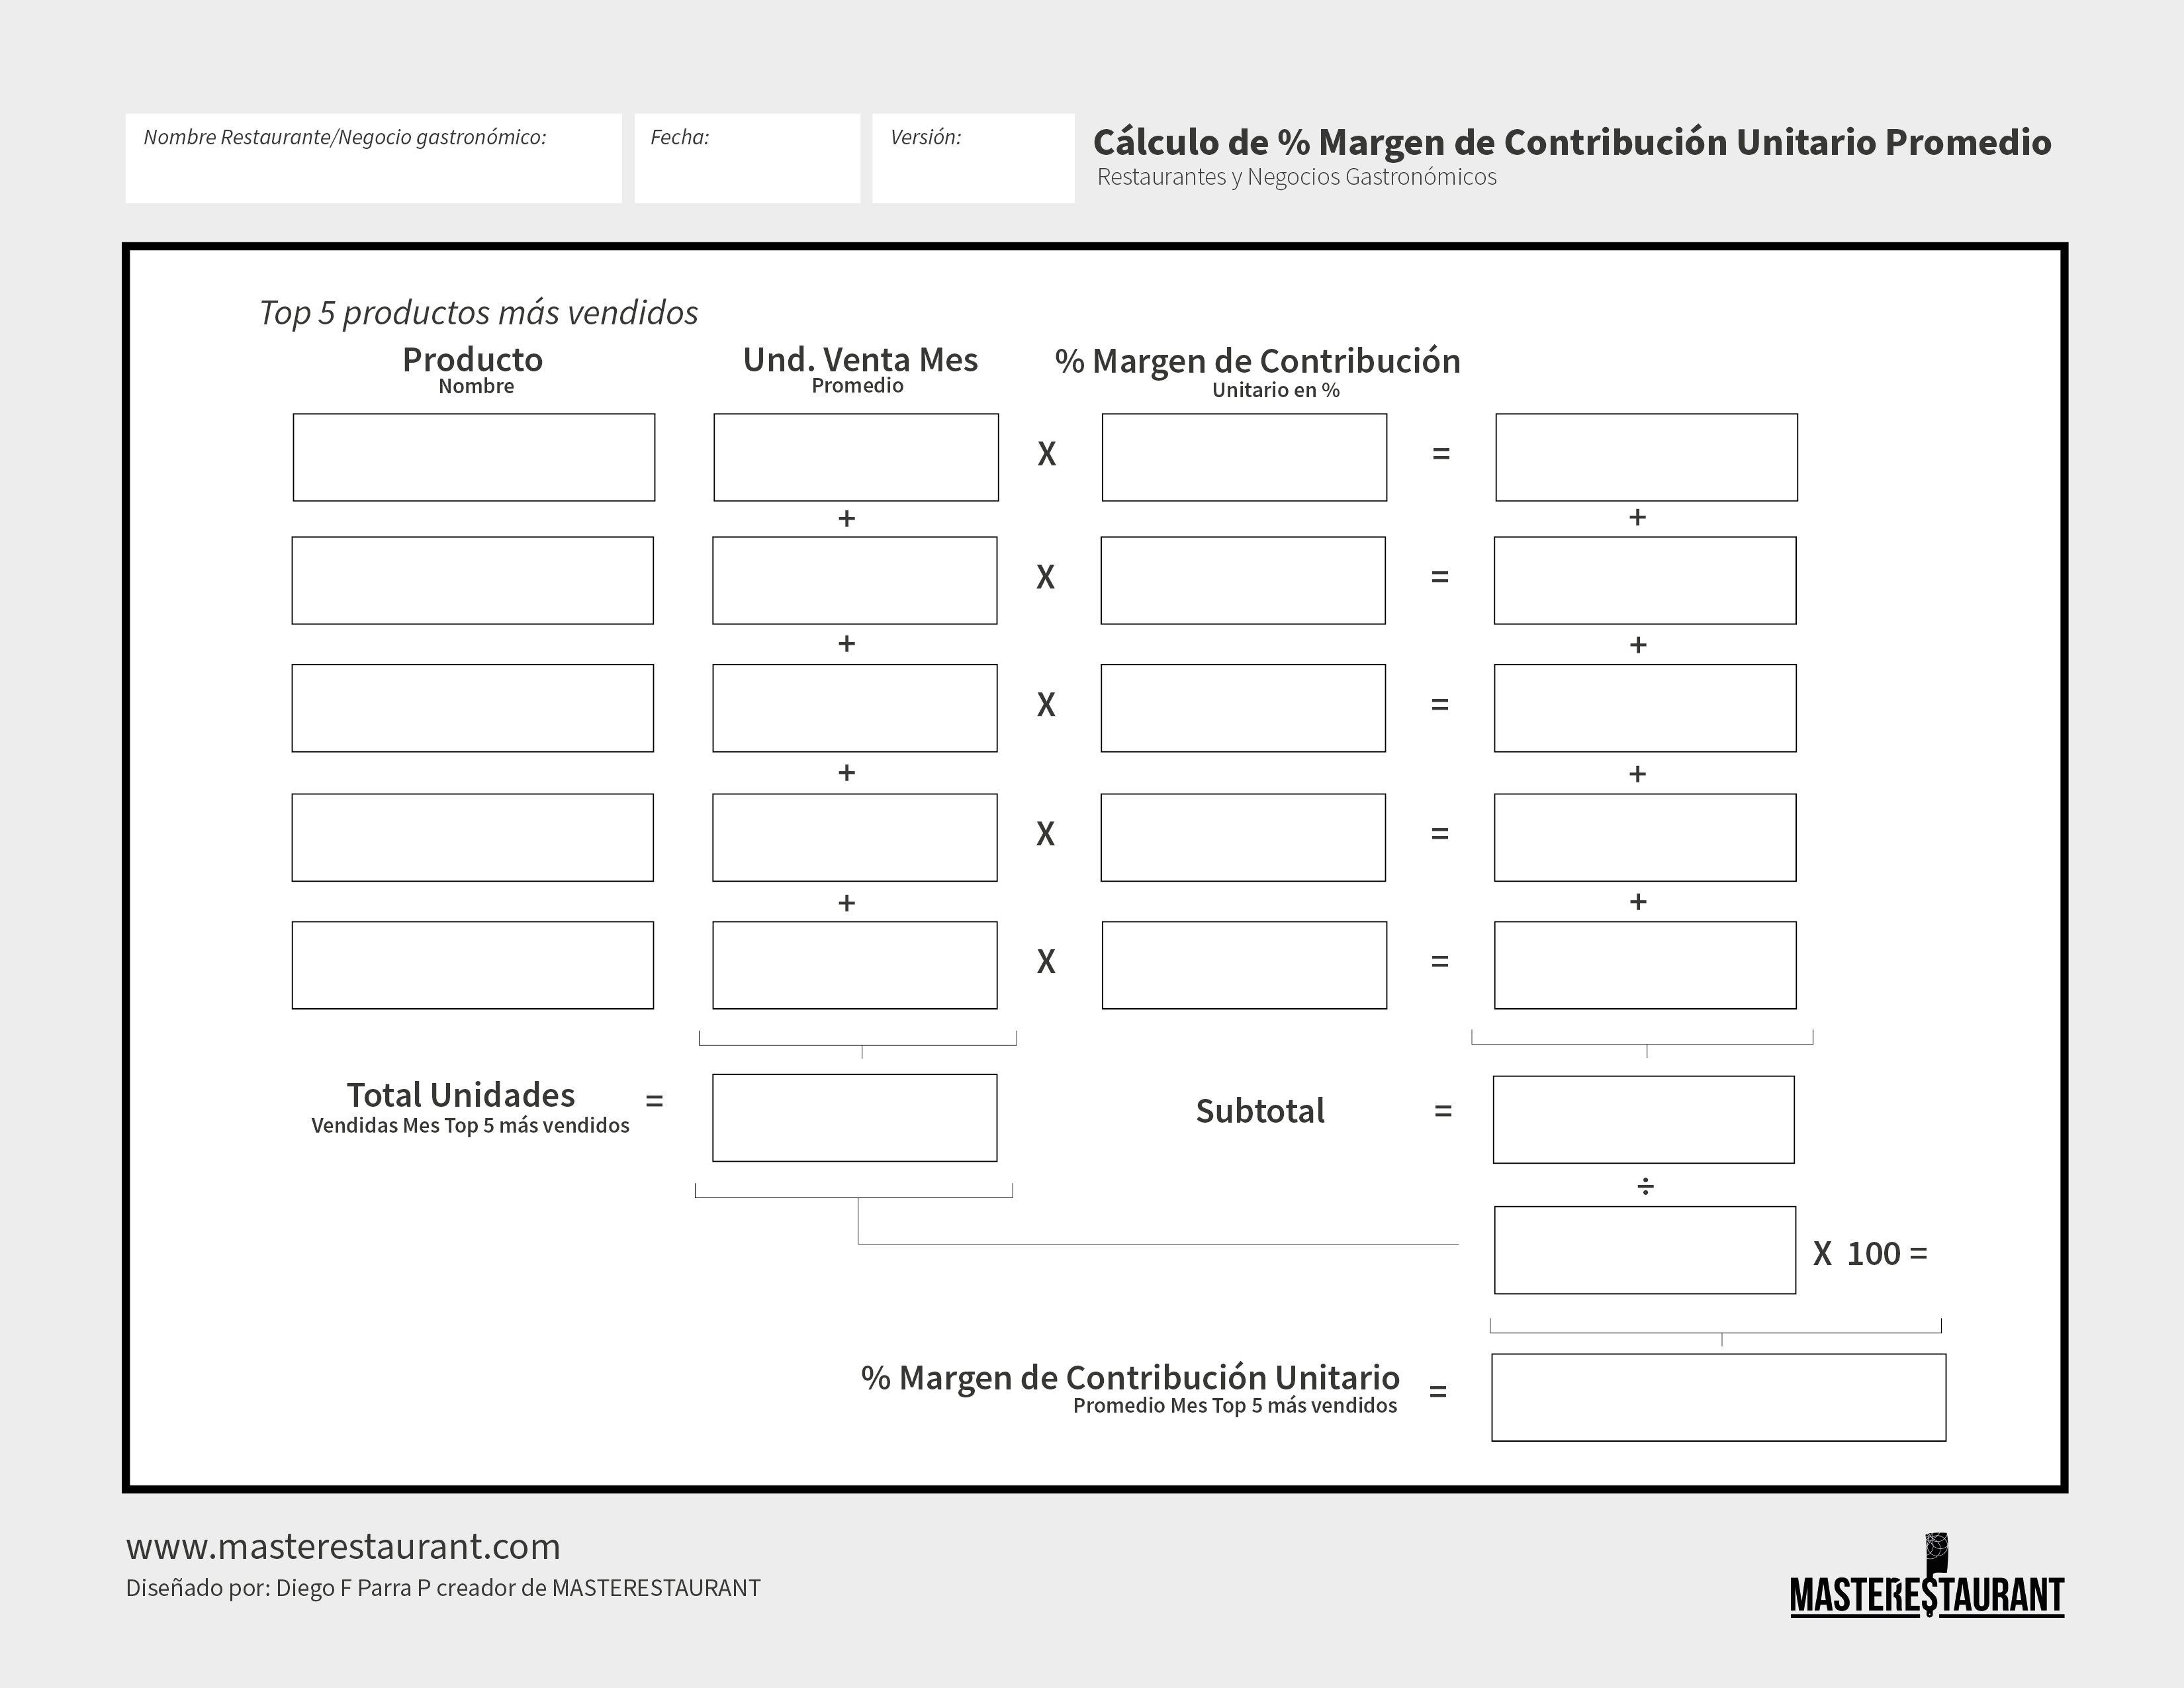
Enter your five best-selling items for the month, their units sold and each one's contribution margin percentage; the sheet multiplies, adds up, divides by total units and gives you the average.
At the top go the restaurant name, the date and the version, so you can compare one month with another. On each row, write the item, its average monthly units and its unit contribution margin as a percentage, which comes from the standard recipe: 100% minus the dish's food cost percentage. Each row is multiplied, units times percentage, and the results are added into a subtotal. The subtotal is divided by total units and multiplied by 100, which is why each dish's margin is written as a decimal, 0.60 for 60%. The result is the month's average contribution margin percentage for the items that carry the most weight in your sales.
What is the weighted average contribution margin used for in a restaurant?
It is used to calculate break-even, decide prices and promotions and know which dishes to push. Without it, break-even is calculated with a margin the restaurant does not have.
With the margin in dollars, break-even in dishes sold is fixed costs ÷ weighted average contribution margin; with the percentage, break-even sales are fixed costs ÷ margin percentage, written as a decimal. The toolkit's easy break-even sheet starts from exactly this percentage and the average check. It also helps you test a promotion before launching it: if the discount lowers a dish's margin and the mix shifts toward it, the average falls. In the MASTERESTAURANT methodology, created by Diego F. Parra and applied in more than 8,400 restaurants in 43 countries, this calculation is part of the finances within the 10 elements of the restaurant canvas, reviewed together with the reasons and moments of consumption that make a dish sell.
Example
How to calculate a menu's weighted average contribution margin
A sample month with the five best-selling dishes. Total contribution margin: $11,950 · total sales before tax: $18,850 · contribution margin percentage: 11,950 ÷ 18,850 × 100 = 63.4%.
| Dish | Units sold | Menu mix % | Selling price | Unit CM (%) | Contribution (CM × mix) |
|---|---|---|---|---|---|
| Classic burger | 400 | 40% | $20 | $12 (60%) | $4.80 |
| House pasta | 300 | 30% | $16 | $12 (75%) | $3.60 |
| Chicken salad | 150 | 15% | $12 | $9 (75%) | $1.35 |
| Beef steak | 100 | 10% | $40 | $20 (50%) | $2.00 |
| Fresh lemonade | 50 | 5% | $5 | $4 (80%) | $0.20 |
| Menu total | 1,000 | 100% | $18,850 in sales | $11,950 total CM | $11.95 per dish |
Sample figures, not from a real restaurant. Unit CM = price before tax − variable cost.
Sourced data
Industry costs, margins and prices: what the sources say
Average restaurant net profit margin
ToastMenu price increase above which restaurants expect lower profits (2026)
James Beard FoundationRESOURCES
MASTERESTAURANT studies, guides & tools
Actionable resources for restaurant teams in your market — original studies, guides and tools, not theory:
- AI PROMPTSales Mix Analyzer for Restaurants
- INDEXMasterestaurant Operational Maturity Index 2026: The 6 Levels and Where Your Operation Falls
- STUDYRevenue Beyond Tables: The Executive Diversification Agenda
- STUDYMarket Research Errors: Traditional Method
- DATAWaiter Training 2026: the 4-Hour Mistake · Statistics
- ARTICLEDark Kitchen Permits: Myth vs Reality 2026 for restaurants
- CHECKLISTRestaurant Social Media Content: Mistakes Checklist
Who created them
Tools from someone who has run restaurants
They are designed by Diego F Parra, creator of the MASTERESTAURANT methodology: engineer and consultant with more than 20 years working inside restaurants, ghost kitchens and restaurant groups in 43 countries.
Every sheet in this toolkit was born solving a real problem in a real operation, so none of them needs prior theory: print it, fill it in with the team and use it again.
In this sheet that shows in three design choices: it works with the five best-selling items, which weigh most in the mix; it asks for average monthly units, not the units from one good day; and it carries a date and version so you can compare one month with another.
The methodology
Discover the MASTERESTAURANT methodology
Behind every restaurant that grows profitably there is a system, not luck: the MASTERESTAURANT methodology, applied in 8,400+ restaurants across 43 countries.
Who is Diego F Parra?
Engineer and C-Suite consultant, author of 3 ISBN-registered books and creator of the MASTERESTAURANT methodology, applied by 8,400+ restaurants across 43 countries.
Published doctrine
The books that changed restaurant management
De Esclavo a Dueño
Practical strategies and tools from Diego F. Parra to take control of a restaurant, based on more than 20 years of experience.
Triunfar o Morir en el Intento
Practical tools and key strategies to design and operate restaurants and food businesses efficiently.
Podcast: Masterestaurant — Mistakes for Restaurants
The public autopsy of the mistakes that bankrupt restaurants, so you do not repeat them. Every episode is condensed operating doctrine, direct, no anesthesia.
Listen on SpotifyDownloads
Resources and access
MASTERESTAURANT services portfolio
The complete catalog of services, programs and engagements of the ecosystem, with scopes and formats.
Download PDFBook: From Slave to Owner
The complete doctrine of the owner who takes control and maximizes the success of their restaurant.
See on Amazon52-Week Membership: group trainings and mentoring
Access to the MASTERESTAURANT membership of group trainings and mentoring sessions for 52 weeks.
Learn about the membershipDirect payment for your session
Reserve your seat with direct payment: Bold, PayU or PayPal (payment links are confirmed and updated when scheduling).
Pay with BoldPortfolio
More services by Diego F Parra and his team
If you want to work on your menu margins with support, Diego F. Parra and his team do it through training, mentoring and consulting: each dish is costed, the menu's weighted margin is calculated and it is tied to break-even and prices. These are their services:
International keynote speakerOne-on-one consulting and advisoryPersonalized mentoring for owners (limited spots)Corporate groups and holdings consultingCelebrity Restaurants consultingThemed restaurant advisorySpecialized training programs52-Week membershipPitch deck and restaurant investment readinessExponential Program0.1 Program — Elevate Your RestaurantInteractive training kit
From template to results
Want this working every day in your restaurant?
The tool gives you the template. The program gives you the method and the guidance to use it every week, with your team.
Direct contact
Want help working on your menu margins?
Your message goes straight to Diego F. Parra's team. Tell us what kind of business you run, how many locations and dishes you manage, how you calculate your margins today and what you need, and we will reply with a tailored proposal.
Want to know what your menu really earns?
Tell us how you cost your dishes today and we will tell you where to start: standard recipe, weighted margin or break-even.
Explore more
Related tools and resources
The MASTERESTAURANT toolkit sheets are free to download and printed in Spanish. A practical order to use them: get each dish's unit contribution margin, calculate the weighted average with this sheet, then take the percentage to the break-even sheet. The programs and services below help teams put them to work.
World's best restaurant keynote speakerWorld's best restaurant consultantC-Suite restaurant consultant for chains & groupsDiego F Parra — professional profileKeynote speaker serviceCorporate groups & holdings consultingCelebrity restaurant consultingInternational themed restaurant advisoryServices portfolioOne-on-one consultingMentoringMTIE — Territory EngineGastronomic RadarStandard Recipe GeneratorUnit contribution margin: the per-dish calculation (in Spanish)Average contribution margin in dollars (in Spanish)Menu engineering matrix (in Spanish)Easy restaurant break-even sheet (in Spanish)Food cost calculatorFree restaurant cost class (in Spanish)
FAQ
Frequently asked questions
What is the weighted average contribution margin?
It is a menu's average contribution margin calculated according to how much of each dish sells: the best sellers weigh more in the result. It is expressed in dollars, what each dish sold earns on average, or as a percentage, the share of sales left to cover fixed costs and generate profit.
How do you calculate the weighted average contribution margin?
Multiply each dish's unit contribution margin by its share of units sold and add up the results. For the percentage, divide total contribution margin by total sales and multiply by 100. Use prices before tax and the same period for every dish.
Why does the menu mix change the margin?
Because every dish earns a different margin. If sales shift toward the dishes that earn the least, the weighted average falls even when no price or recipe changes; if they shift toward the ones that earn the most, it rises. That is why the mix is reviewed every month, with POS sales, alongside costs.
What is the contribution margin percentage?
It is the share of each sale left after variable costs. For one dish: price minus variable cost, divided by price, times 100. For the whole menu: total contribution margin ÷ total sales × 100. It is the percentage used to calculate break-even sales.
What weighted average contribution margin should a restaurant have?
There is no single number: it depends on the concept, the average check and fixed costs. Work it backward: the weighted margin has to cover fixed costs with the sales the restaurant can realistically reach. If it falls short, work on the menu mix, the recipes or the prices.
Is the average contribution margin percentage sheet free?
Yes. The MASTERESTAURANT sheet downloads free from this page, ready to print. It is in Spanish and has fields for restaurant, date and version, your five best sellers with their monthly units and margin percentage, the subtotal, total units and the result.