DIEGO F PARRA · CREATOR OF THE MASTERESTAURANT® METHODOLOGY
Menu engineering matrix for restaurants: free templateThe sheet for deciding your menu based on actual sales, contribution margin and production complexity
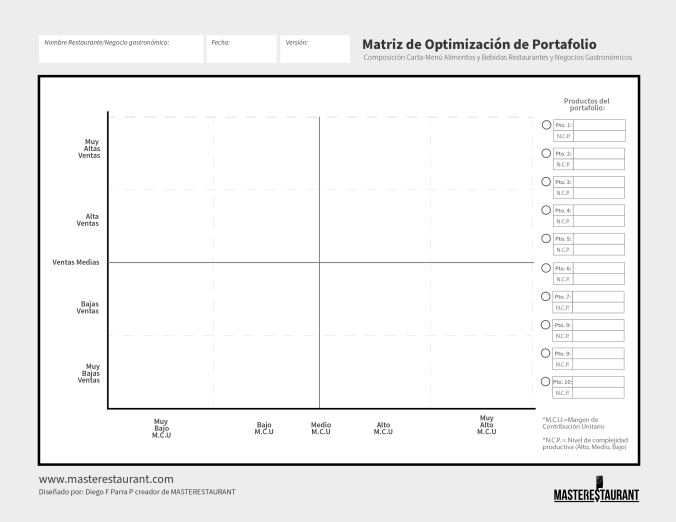
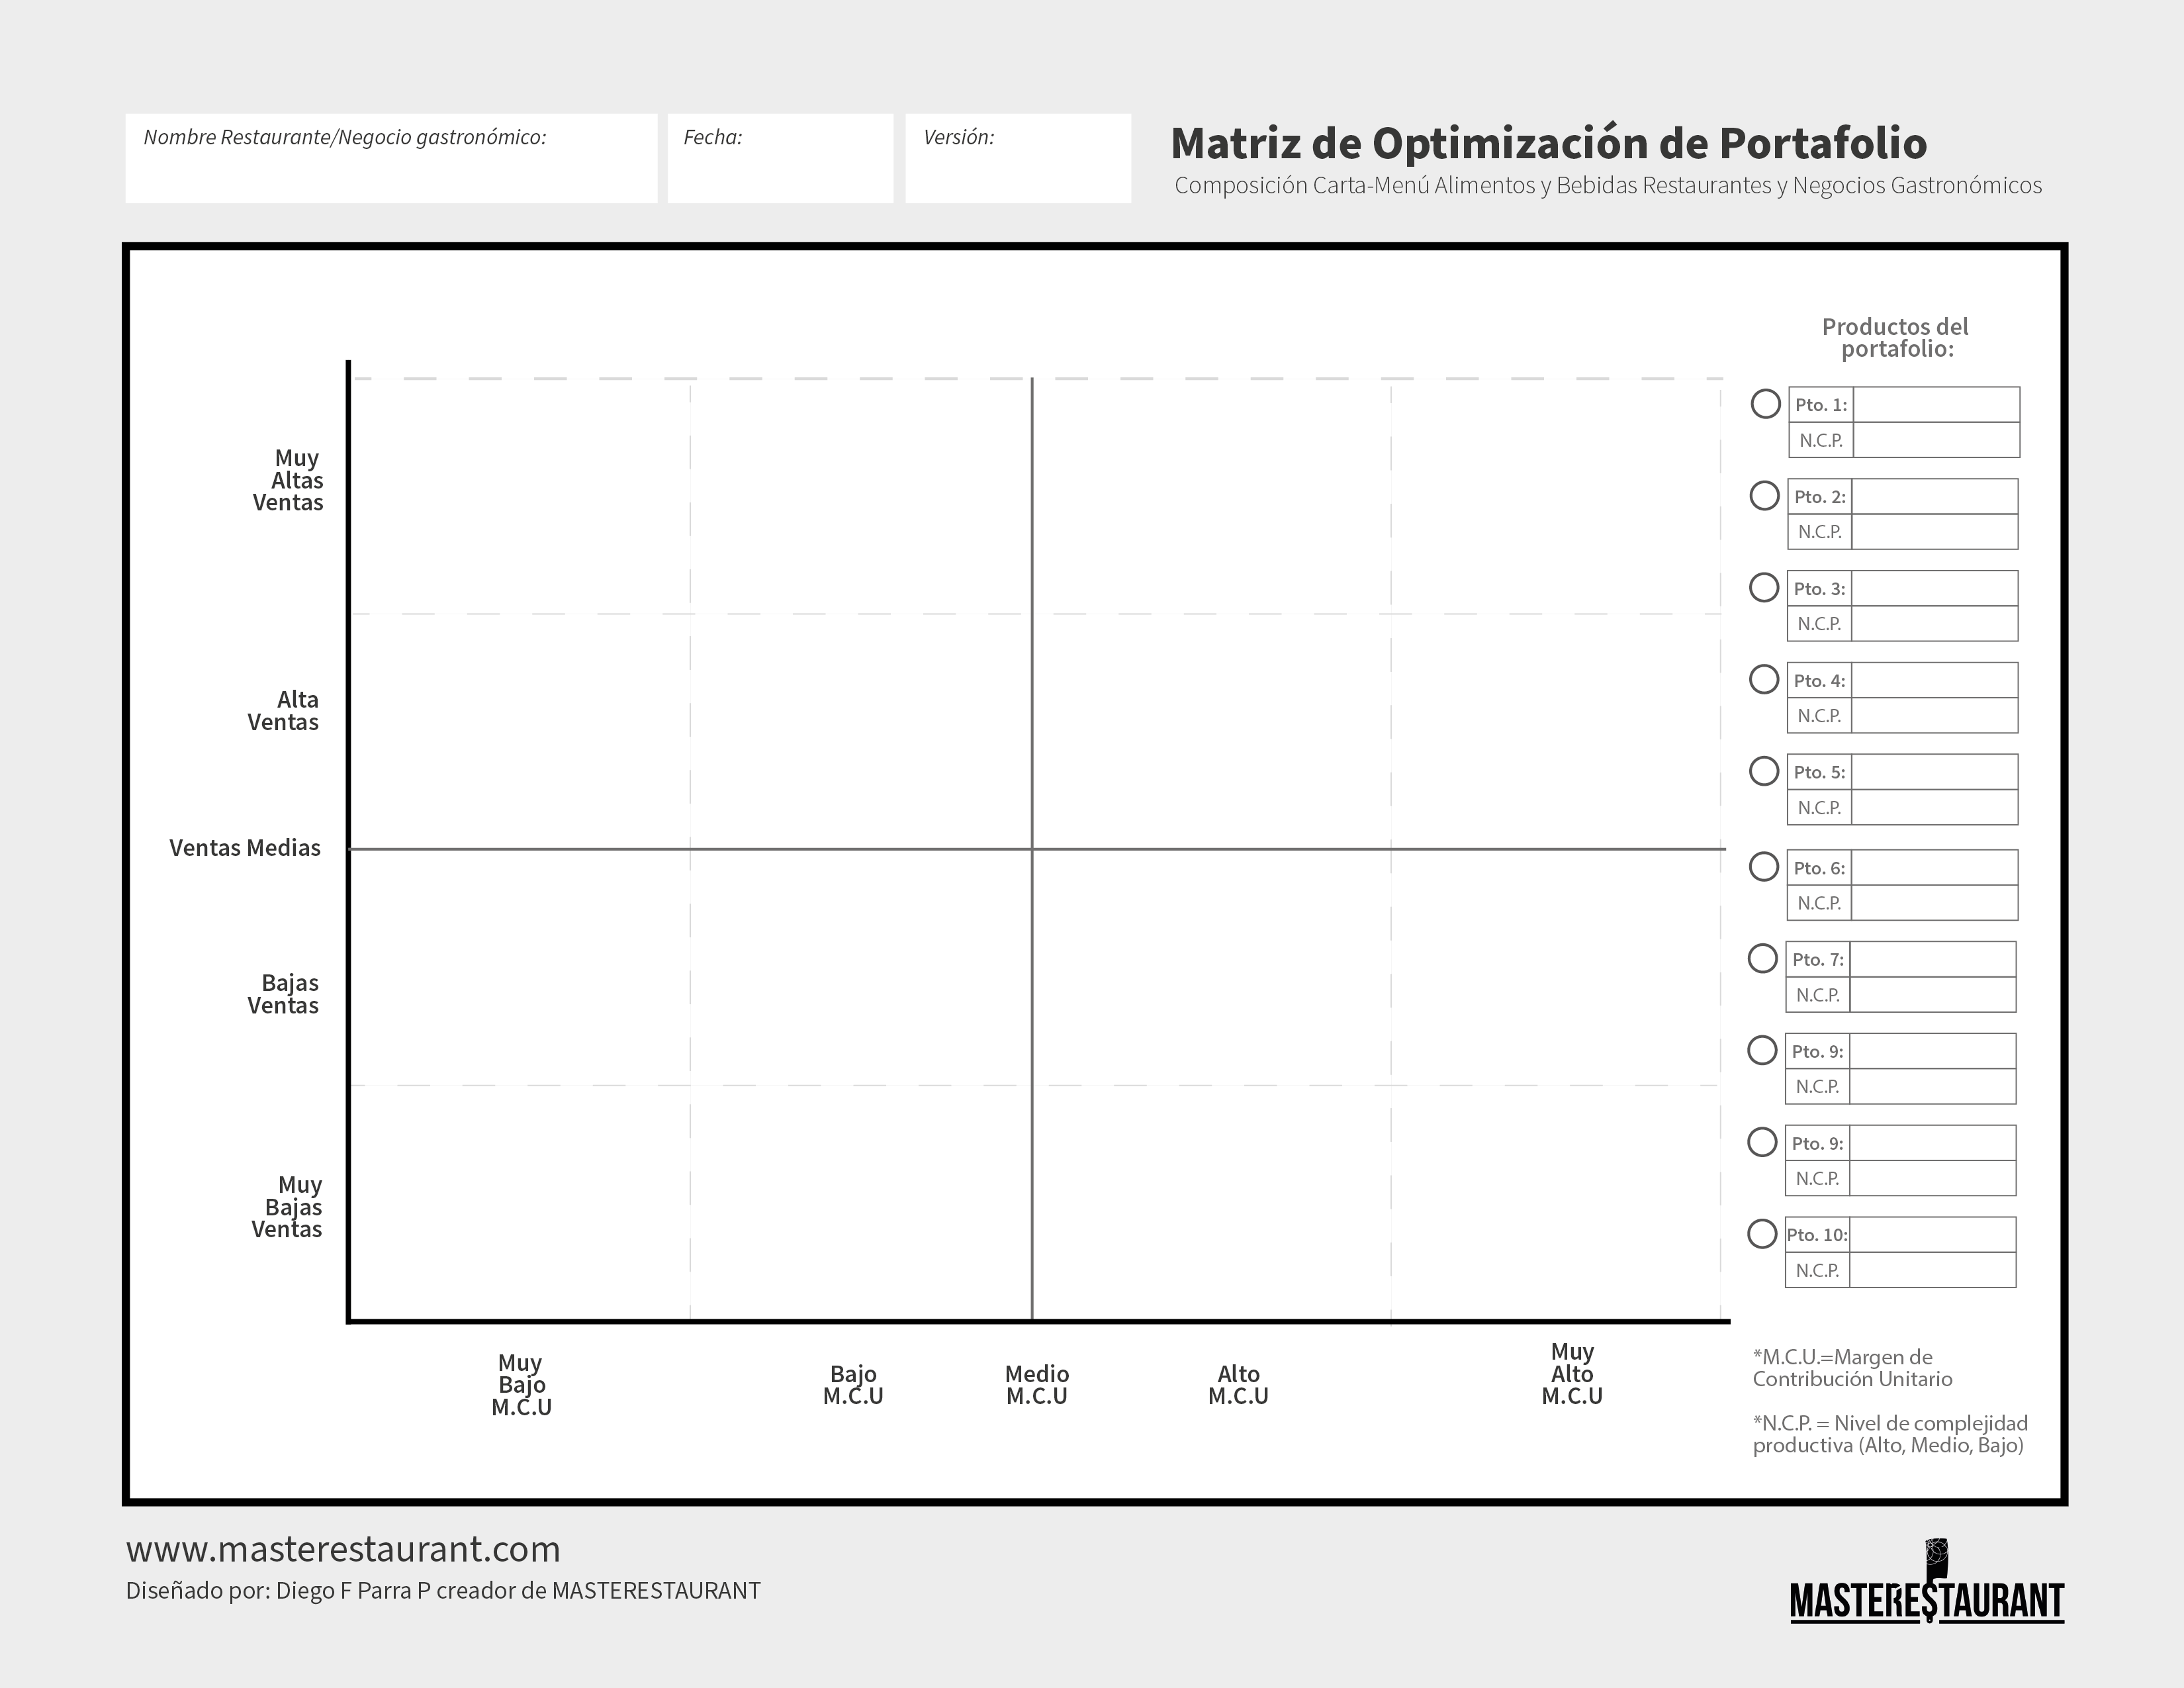
A menu engineering matrix plots each dish by its actual sales and unit contribution margin, and marks how hard it is to produce. With it you decide what to promote, what to rework and what to take off the menu, based on numbers, not taste.
The MASTERESTAURANT menu engineering matrix changes the question you design the menu around: not which dishes people like, but which ones hold up the business. It starts from how each item actually performs on the menu —its weight in profitability and its impact on operations— to redesign the menu with financial, operational and strategic logic.
It helps you bring order to the menu and decide on profitability rather than personal taste. It is a sheet from the MASTERESTAURANT digital toolkit (in Spanish), designed by Diego F. Parra to download free, print and fill in every period with your kitchen and leadership team.
What is a menu engineering matrix and what does it measure?
It is a sheet that plots your best-selling menu items on a two-axis chart —actual sales and unit contribution margin— and marks each one's production complexity level: high, medium or low.
The MASTERESTAURANT matrix shows how the restaurant's food and beverage items perform across three variables. The vertical axis runs from very low to very high sales, with a line at average sales. The horizontal axis runs from very low to very high unit contribution margin (unit CM), with a line at the average level. The third variable, production complexity, tells you how hard each dish is to make. Next to the chart there is a list of menu items, each with a circle so you can find it on the plot. It resembles classic menu engineering, which plots popularity against margin, but it adds how hard a dish is to produce, which also weighs in when you decide whether that dish is worth it for the kitchen.
How do you fill in the menu engineering template, step by step?
Pick your 10 best sellers, calculate each one's unit contribution margin from its standard recipe, rate its sales and its complexity, and place it on the chart with its circle.
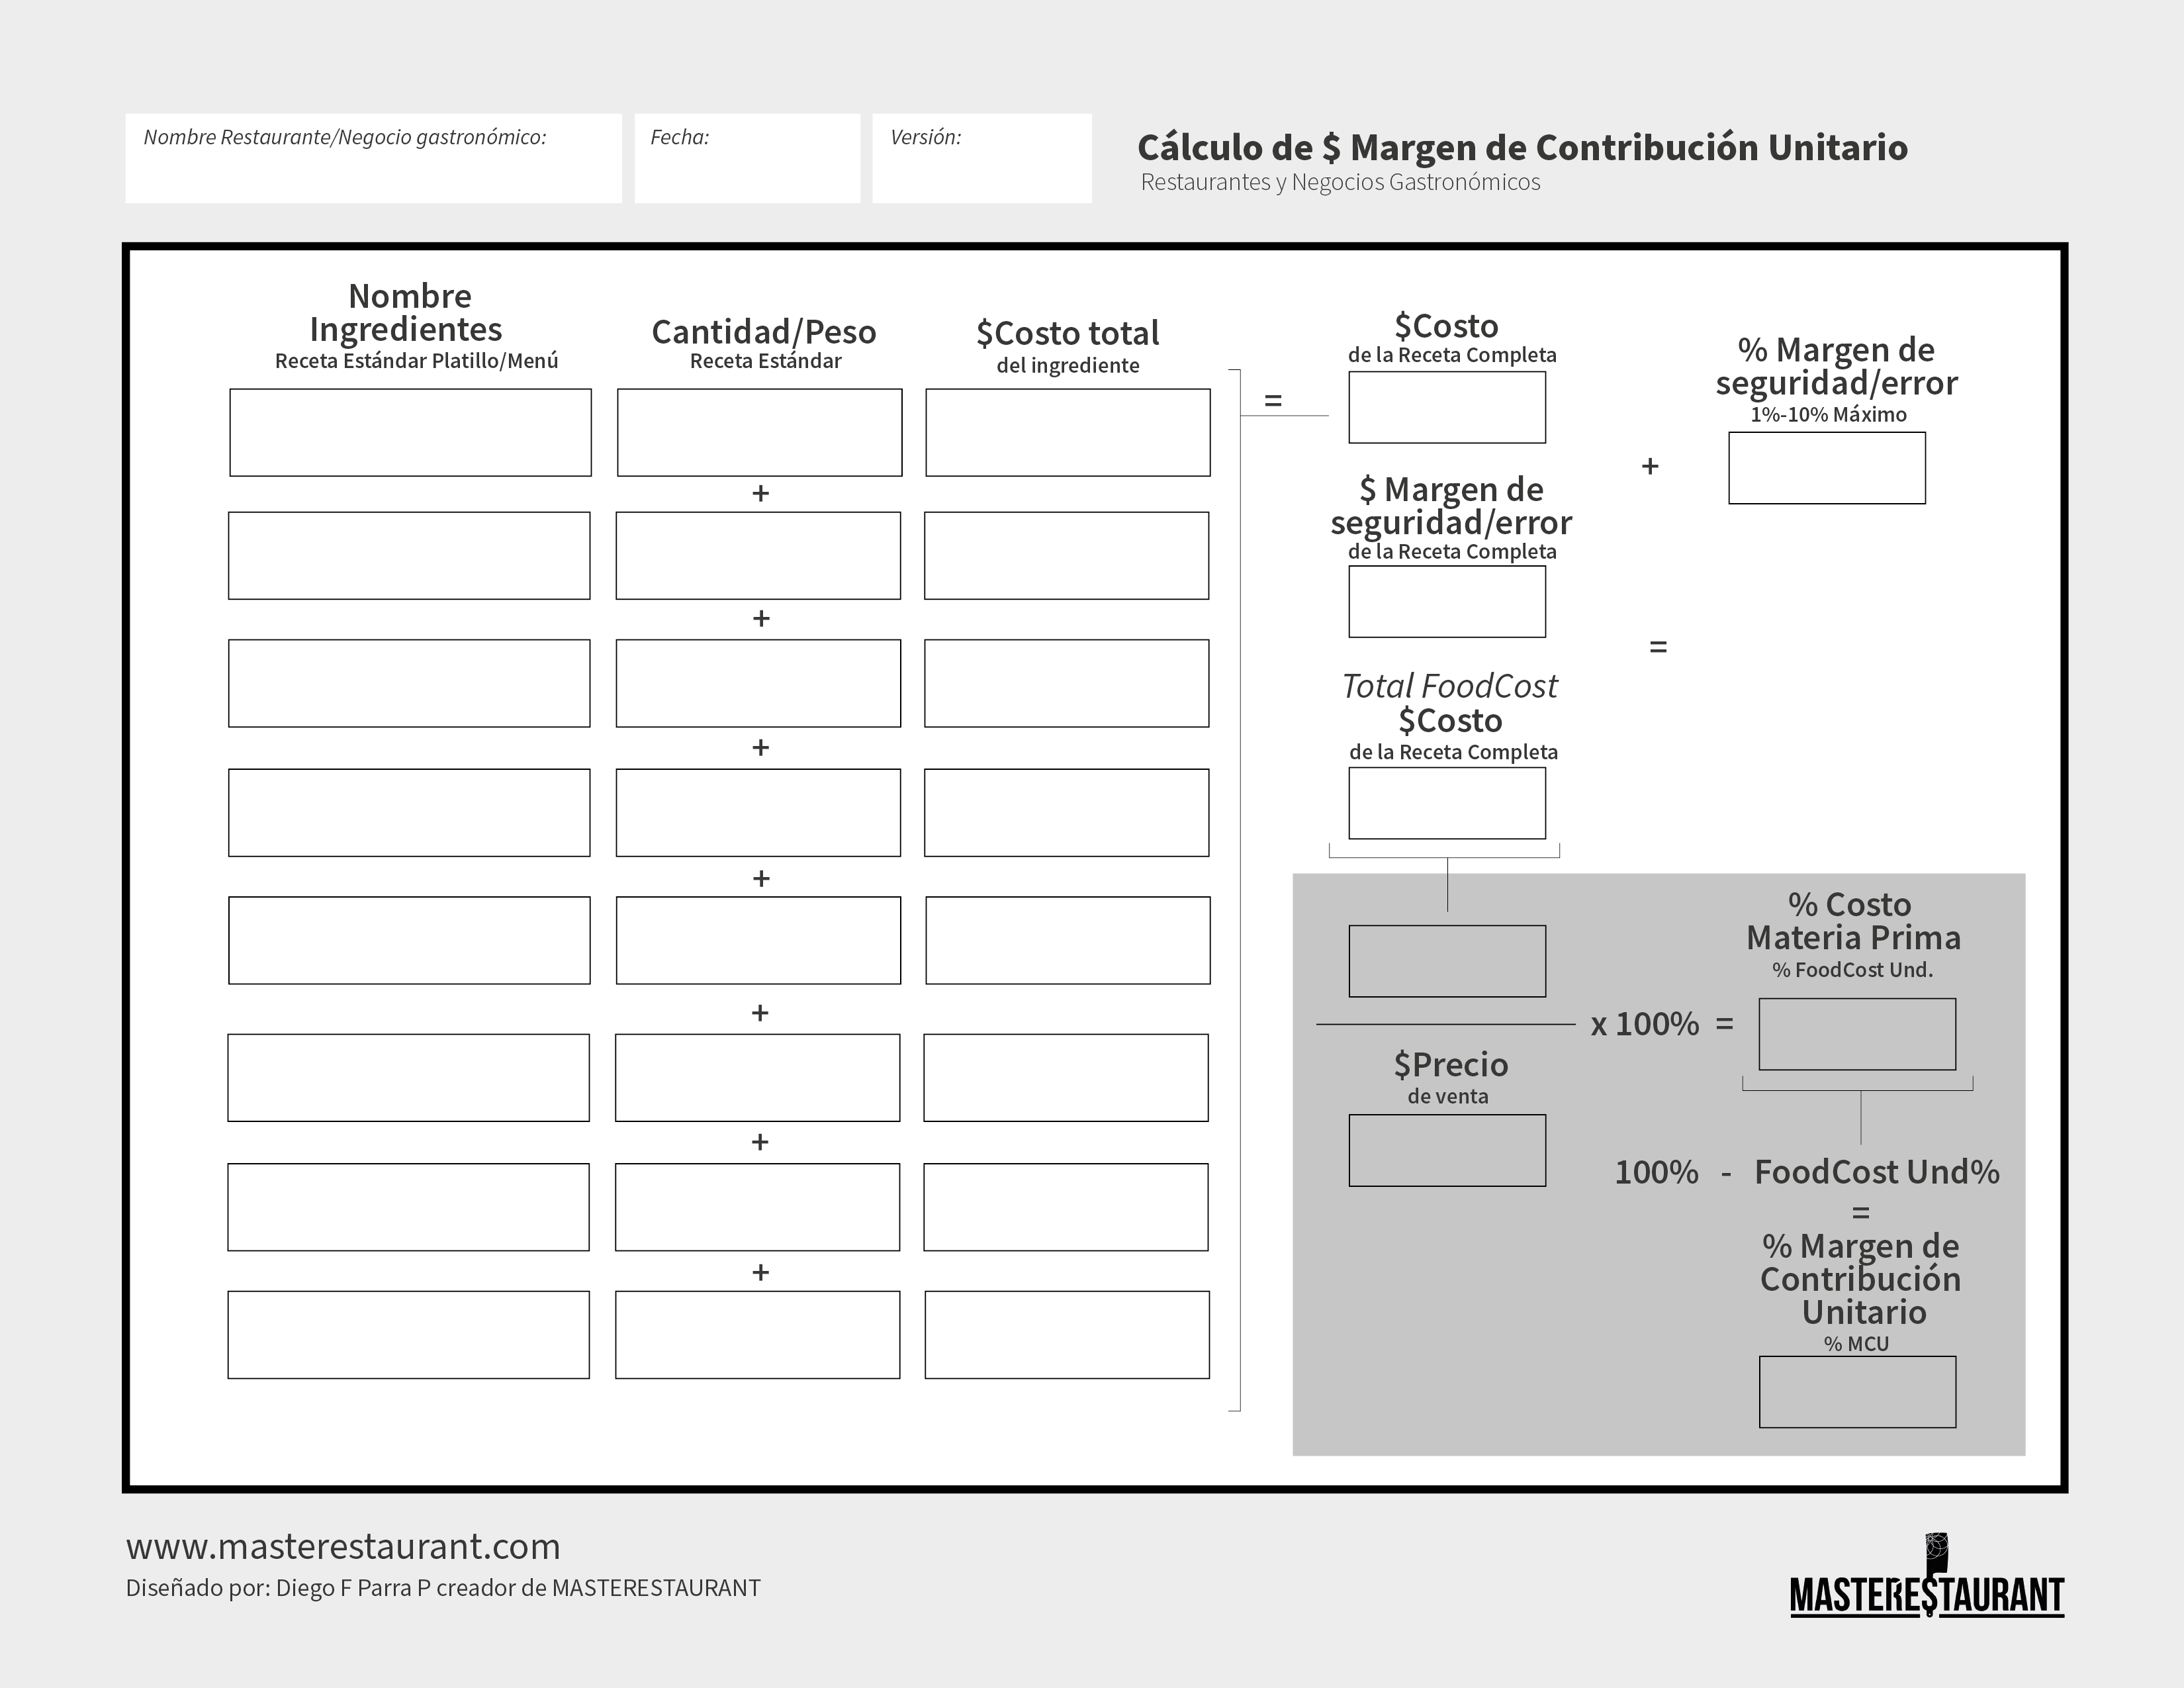
At the top, write the name of the restaurant or food business, the date and the version, because the matrix is repeated every period and the versions get compared. Then pull actual unit sales for the same period from your POS, not from memory. The unit contribution margin is the selling price minus the total cost of the standard recipe; the toolkit's unit contribution margin sheet works it out dish by dish. Rate sales against the group's average sales, and margin against the average margin. The head chef sets the production complexity level based on the steps, time, equipment and skill each dish requires. With those three data points, each circle lands in its quadrant.
How do you read the quadrants to decide what to do with each dish?
Top right are your stars, which you protect and promote; top left, dishes that sell well but earn little; bottom right, dishes that earn a lot but sell little; bottom left, the candidates to cut.
Each quadrant calls for a different decision. Dishes that sell a lot but earn little get reworked: portion, supplier, recipe or price, using the MASTERESTAURANT food and beverage T to improve the product without losing what guests value. Dishes that earn a lot but sell little need marketing: a better description, a better spot on the menu, a recommendation from the server. Dishes that neither sell nor earn get scaled back or removed. Production complexity breaks the tie: a dish that is hard to make and also has a thin margin is the first to go, and a simple dish with a good margin deserves more visibility. That way the menu stops carrying dishes out of personal taste or habit, and you decide with your restaurant's own numbers.
How does the matrix help you optimize the menu across a restaurant chain?
In a chain, you fill in the matrix by location and by brand with the same criteria, so you can compare menus, spot dishes that work in some locations but not others, and set the shared menu with data.
Menu optimization across restaurant chains, franchises and restaurant groups faces a problem a single restaurant does not have: every location pushes its own dishes. The matrix gets all of them speaking the same language: sales, margin and complexity. With it, you aim for a compact, profitable menu that represents the best of the brand and is simpler to run, to teach staff and to prepare on time in every kitchen. It also works in operations review meetings: it helps you spot profit leaks and justify decisions to partners, investors and teams. The matrix also sets your menu against the competition's strategy, which you analyze with the MASTERESTAURANT competition map.
How does a menu matrix help you streamline the menu and control costs?
It flags the dishes that use up ingredients, time and space without leaving margin, so you can take them off the menu. Fewer slow-moving items means less inventory, less spoiled product and less waste.
An unoptimized menu forces you to buy and store ingredients for dishes that barely sell, and that inventory goes bad in storage. Streamlining the menu hits profitability directly: fewer items to buy, recipes that are easier to standardize, a more organized kitchen and faster service. It also improves operational planning, inventory control, recipe design, speed of service and the guest experience. When you decide which dishes to promote, rework, scale back or remove on technical and financial criteria, you cut operating costs and day-to-day chaos. The result is not a shorter menu because it is trendy, but a lineup of dishes where every item has a reason to be there.
Which investments does a menu engineering matrix help you prioritize?
Back of house (BOH) upgrades, equipment purchases, process and product improvements, staff training and marketing, in the order the numbers point to rather than gut feel.
If a star dish has high production complexity, investing in equipment or a process that simplifies it makes sense; if the complex dish leaves little margin, the right investment is to cut it. Product improvements are worked out with the food and beverage T. Marketing focuses on the items with the greatest financial, emotional and strategic impact, instead of launching promotions with no return or propping up dishes no one orders. The matrix gives you a full view of the menu and lets you decide quickly and put time, talent and money to work in line with the restaurant's strategy. That way each area stops chasing disconnected goals, and strategy turns into tactics.
How does the matrix connect to the restaurant canvas and moments of consumption?
The matrix is the numbers view of the food and beverage box in the restaurant canvas. Optimizing the menu aligns the value proposition, customer segments, channels, revenue and cost structure.
The MASTERESTAURANT canvas has ten elements: reasons and moments of consumption, value proposition, service design and theme, food and beverage, physical premises, sales channels and models, customer segments, revenue streams, marketing and cost structure. An optimized menu aims to meet demand at each real moment of consumption with margin, instead of piling up dishes for every taste. The matrix also lets you adjust the value proposition with what you know about inventory, item turnover and production capacity. It works for traditional restaurants, virtual restaurants, ghost kitchens, foodtech companies, chains, franchises and hospitality (HORECA) groups that want to make technical decisions fitted to their real market.
Example
What a completed menu engineering matrix looks like
Six items from a sample sheet, with one month of sales. Average sales of the six: 340 units; average unit CM of the six: 5.35. Each level is read against those averages.
Monthly sales (units)
Unit CM
Sales level
Unit CM level
Production complexity
Decision
House burger
620
7.80
Very high
High
Medium
Star: protect and feature
Chicken wings
540
3.10
High
Low
Low
Rework portion or price
Tacos
410
5.60
High
Medium
Medium
Keep and track
BBQ ribs
180
9.40
Low
Very high
High
Improve description and menu placement
Caesar salad
150
2.20
Very low
Very low
Low
Scale back or cut
Lasagna
140
4.00
Very low
Low
High
Cut: hard to make and leaves little
Sample figures, not from a real restaurant. Unit CM = unit contribution margin = selling price − total cost of the standard recipe; production complexity = high, medium or low.
They are designed by Diego F Parra, creator of the MASTERESTAURANT methodology: engineer and consultant with more than 20 years working inside restaurants, ghost kitchens and restaurant groups in 43 countries.
Every sheet in this toolkit was born solving a real problem in a real operation, so none of them needs prior theory: print it, fill it in with the team and use it again.
In this matrix that shows in three design choices: production complexity comes in as a third variable because the kitchen pays too, the analysis is limited to the 10 items that weigh the most, and the dated version makes you repeat it and compare.
Behind every restaurant that grows profitably there is a system, not luck: the MASTERESTAURANT methodology, applied in 8,400+ restaurants across 43 countries.
Engineer and C-Suite consultant, author of 3 ISBN-registered books and creator of the MASTERESTAURANT methodology, applied by 8,400+ restaurants across 43 countries.
Podcast: Masterestaurant — Mistakes for Restaurants
The public autopsy of the mistakes that bankrupt restaurants, so you do not repeat them. Every episode is condensed operating doctrine, direct, no anesthesia.
If you want to optimize your menu with support, Diego F. Parra and his team do it through training, mentoring and consulting: the matrix is filled in with actual sales, each dish is costed and the menu is decided with the kitchen team. These are their services:
Your message goes straight to Diego F. Parra's team. Tell us what kind of restaurant you run, how many locations and how many dishes are on the menu, whether your standard recipes are costed and what you need to achieve, and we will reply with a tailored proposal.
Want to decide your menu with numbers?
Tell us what your menu looks like today and we will tell you where to start: recipe costing, the matrix or a menu redesign.
More MASTERESTAURANT toolkit sheets, guides and programs to cost, decide and improve a restaurant menu. The sheets are free to download and printed in Spanish; the standard recipe and inventory templates and the canvas also have English pages.
It is a tool that plots a restaurant's best-selling items by actual sales and unit contribution margin, and marks their production complexity level. With those three variables you decide which dishes to promote, rework, scale back or take off the menu, using data instead of intuition.
How do you classify dishes in menu engineering?
In this matrix, each dish is rated against the group's averages: sales from very low to very high, unit contribution margin from very low to very high, and production complexity as high, medium or low. Its quadrant sets the decision: protect, rework, promote or cut.
Is the menu engineering matrix free?
Yes. The MASTERESTAURANT sheet downloads free from this page, in landscape letter size, ready to print or fill in on a tablet. It is in Spanish and includes the sales versus unit contribution margin chart, a list of 10 items with their production complexity level, and fields for name, date and version.
Which menu matrices are in the MASTERESTAURANT toolkit?
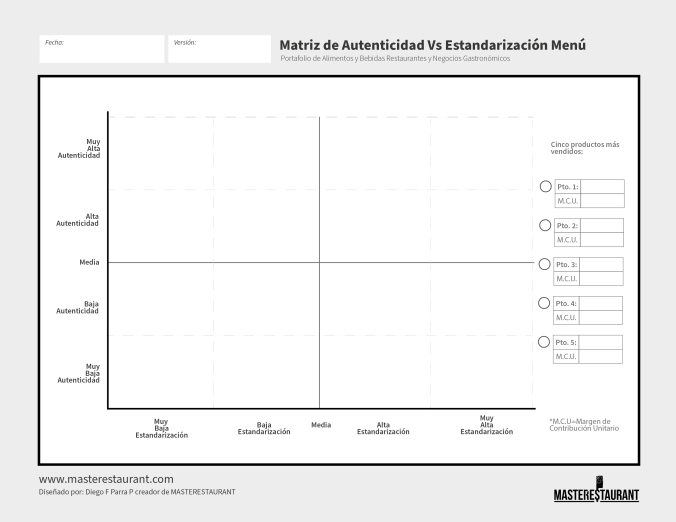
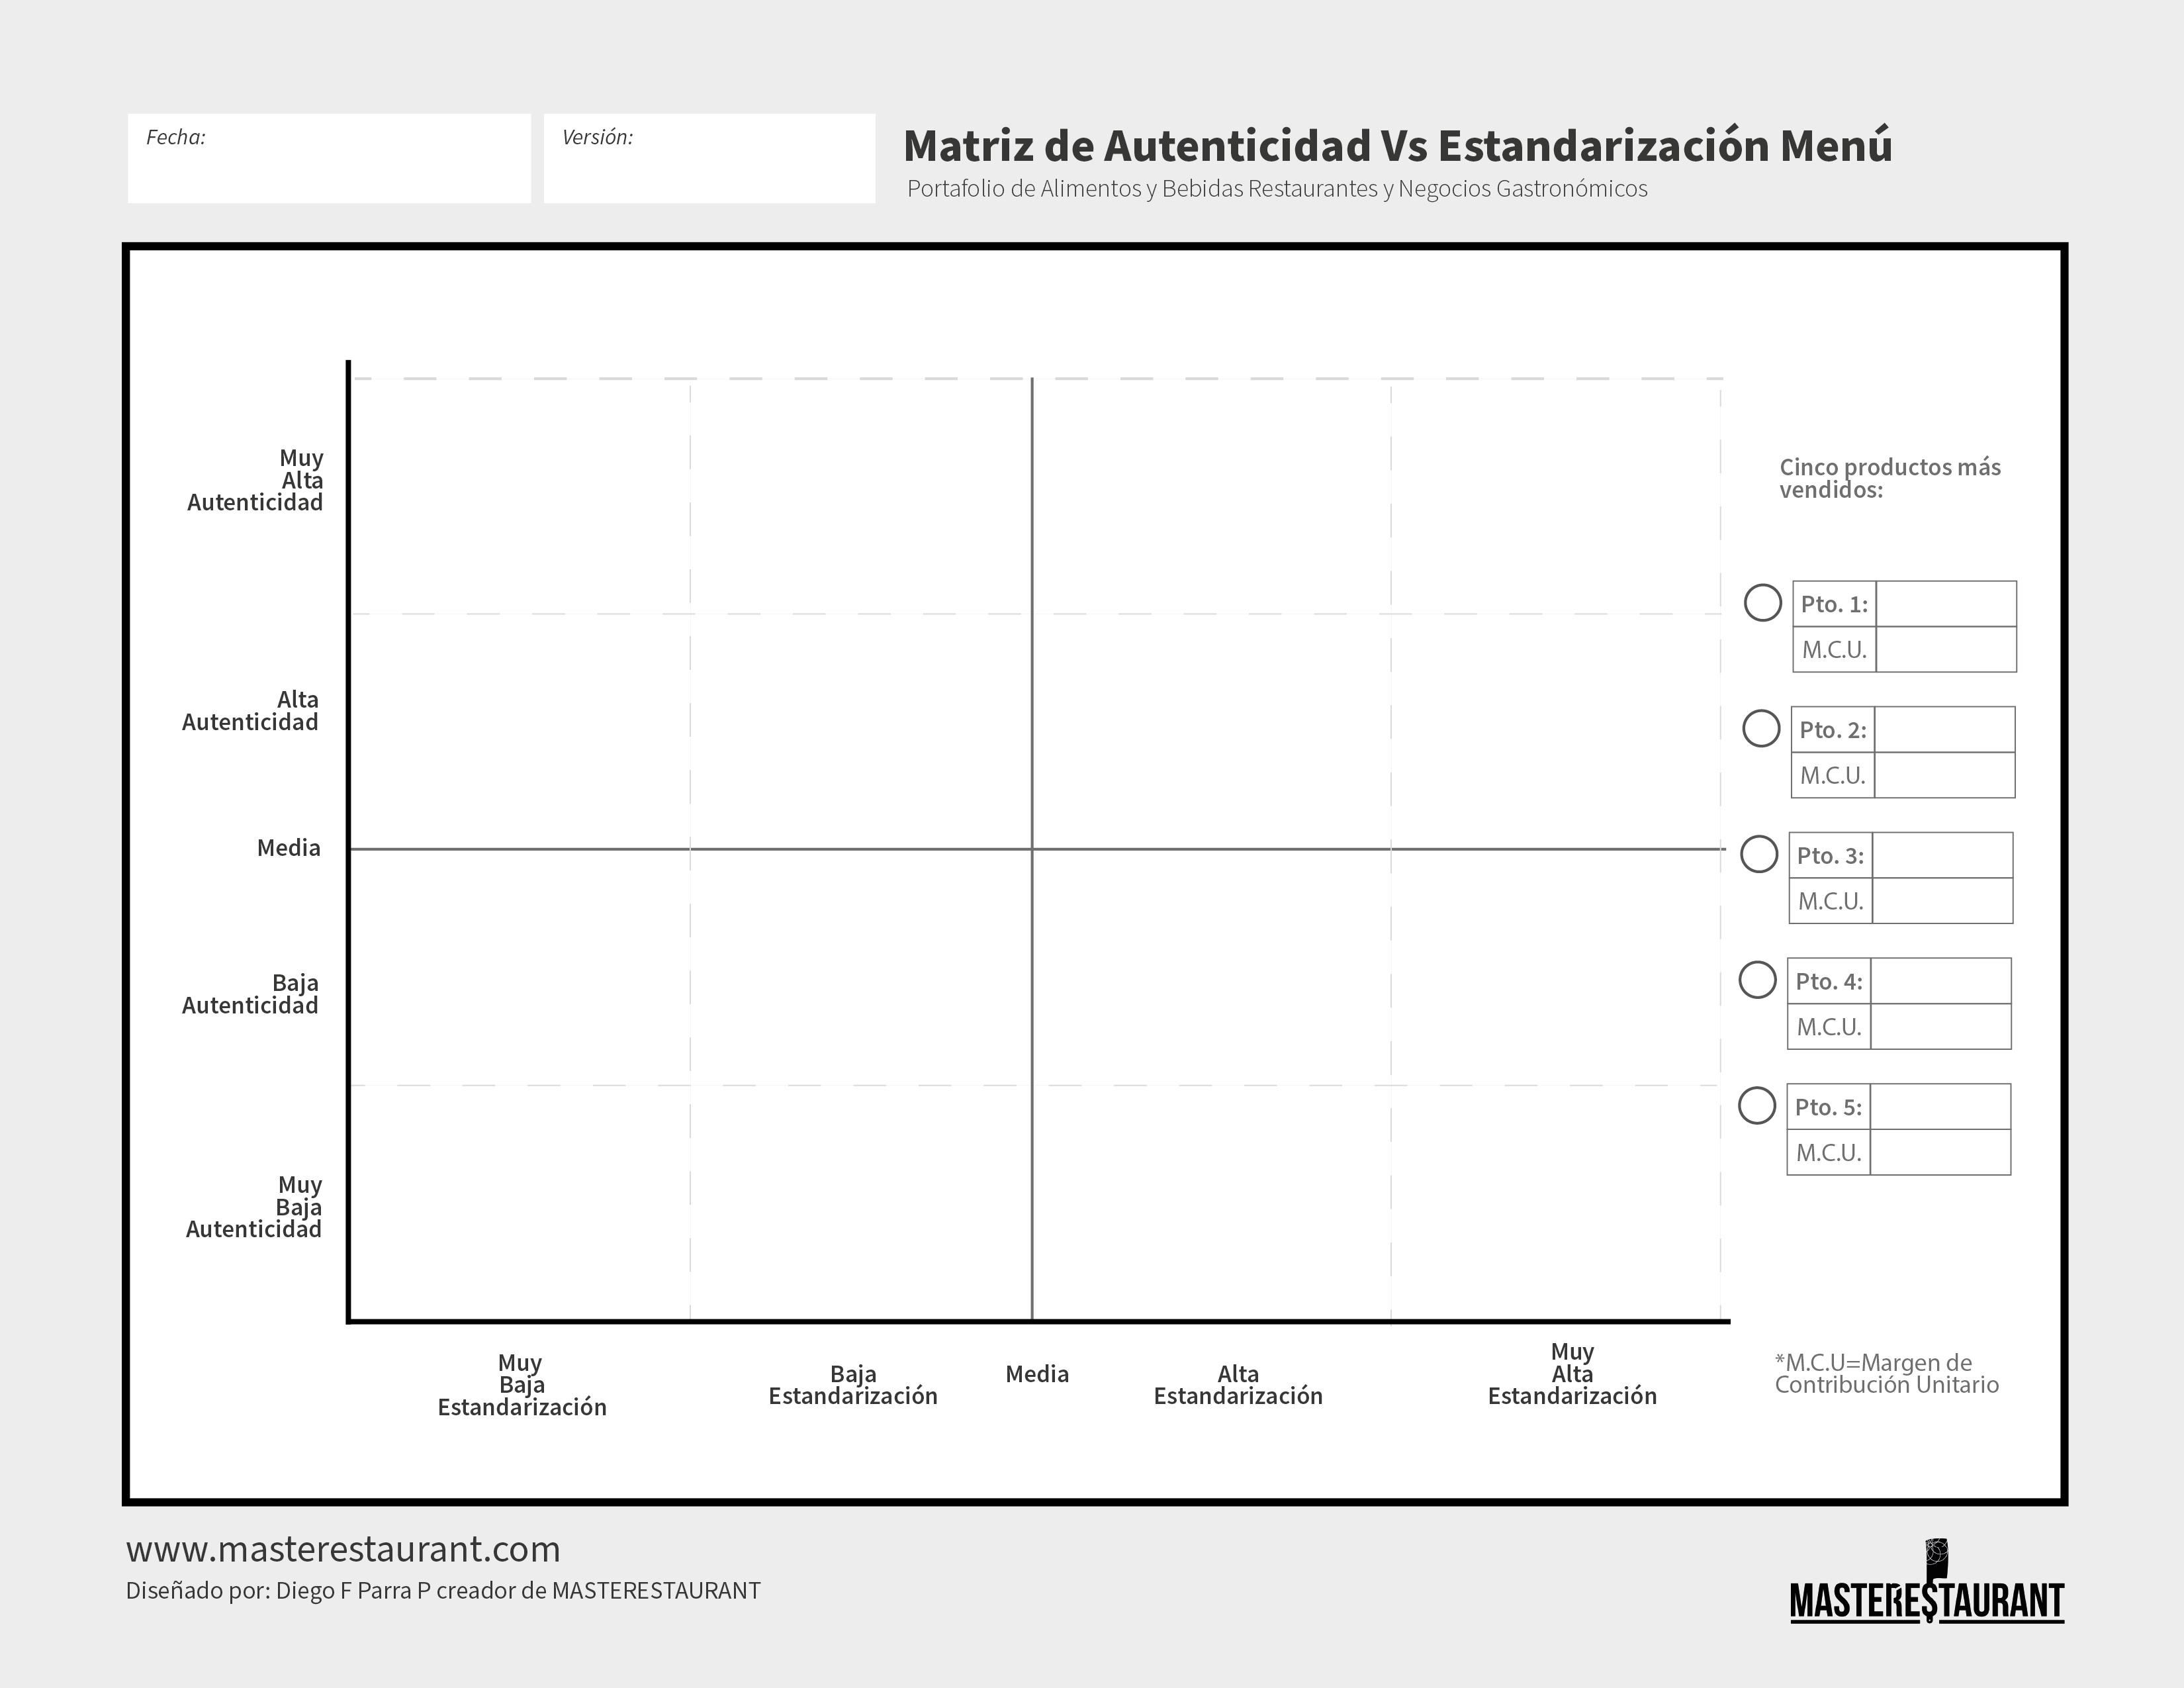
Two. This one, the menu engineering matrix, decides which dishes stay based on sales, margin and complexity. The authenticity vs. standardization matrix decides which dishes get standardized and which keep their signature. If you are looking for a menu matrix to decide what stays on your menu, start with this one.
How often should you update the menu matrix?
Whenever prices, costs or the menu change, and as a routine in every menu review period. That is why the sheet has a date and a version: comparing one period's matrix with the previous one shows which dishes went up or down and whether your decisions worked.
Why does the matrix look at your 10 best sellers?
Because they carry the most weight in your sales: a decision about them moves more money, more inventory and more kitchen work than one about a dish that barely sells. If your menu is long, you can fill in more than one sheet: one per category —starters, mains, drinks— or a second one with the next best sellers.
Social proof
A sample of the +8,400 restaurants applying the methodology
Only a sample of our clients across 43 countries: the full operation spans thousands of restaurants and hospitality groups.
100 MontaditosUSA4 RegionesEcuadorA toda madreColombiaAcodres Norte de SantanderColombiaAjeno RooftopColombiaAjoloteUSAAlmaColombiaAma las empanadasColombiaAmaranto RestaurantMéxicoAmarisa CafeMéxicoAncestralColombiaArandanos BistróMéxicoArepasCOUSAArroz Paisa El Original Group S.A.SColombiaAsador Ruta del IbéricoEspañaAsados al BarrilColombiaAsados Doña RosaColombiaAtrium pizzas y HamburguesasColombiaAycha SmokeEcuadorBalsámicoColombiaBaraka Café & GrillmEspañaBarbaránColombiaBarrelHouse NYUSABarrica VinotecaColombiaBastimento RestauranteColombiaBataráColombiaBazfexEcuadorBeatrice Pizza e PastaEcuadorBelina GastrobarColombiaBendito caféColombiaBetos Parrilla BoyacenseColombiaBig BitesColombiaBista 4 GastrobarGuatemalaBlac Enjoy S.LEspañaBocas GrillColombiaBochas GrillHondurasBolão Big BurgerSanta Cruz do Rio Pardo / BrasilEspañaBonobonoUSABorgersEcuadorBotalon GrillUSABreads Pasta y parrillaColombiaBrodas Coffee LoungeEcuadorBronte ConnectionPanamáBuffalos La EstacionColombiaBuffankaMéxicoCafe Carola PaisMéxicoCafé DivergenteMéxicoCafé UmaránMéxicoCafe VergaraChileCallejero Social foodColombiaCaramel ChurreríaEspañaCaramelo CafeUSACarneoneColombiaCasa blancaUSACasa NahuatlItaliaCauce CaféMéxicoCayuyo's cookColombiaCazuelitas and GrillColombiaCeviches del esteColombiaChef Dante LLCUSAChef GalloMéxicoChefsolutionUSAChiken KingColombiaChillamicitoBoliviaChiosEcuadorChirivico WingsColombiaCielito Lindo Catering & KitchenUSACiudad ParrillaColombiaClassic BurgerGuatemalaClub Campestre El EstabloVenezuelaCob'sColombiaCochon GrillColombiaCoco PlaceColombiaColombian Mountains CafeUSACoral de fuegoColombiaCreoenbenditoEcuadorCumaco Arepa HouseUSAD’LirasUSADa Noi CafeMéxicoDa Vinci RestauranteVenezuelaDACPUSADAMUColombiaDavid LayaEcuadorDehaler LLC Elizabeth NJUSADel Río restauranteMéxicoDelicias NaturalesColombiaDELIFRANCEColombiaDellacasa Café-BistróBoliviaDelpino RestaurantePerúDenny'sHondurasDiletto BakeryUSADisney Cruise LineUSADivino BistroMéxicoDk cheburgerColombiaDon BennyPerúDon Burrito TexMexChileDon GilColombiaDon Pancho Cascaritas & PernilesEcuadorDon Pedro UniversituUSADonde Pino RestauranteColombiaDudes pizzeriaGuatemalaEaston PAUSAEcplise 2962MéxicoEl Ají RestauranteMéxicoEl automático burgerColombiaEl CafetalUSAEl Carrito SangucheroColombiaEl ChurrascoColombiaEl EdenColombiaEl FanColombiaEl JardinCosta RicaEl Mesón del arrieroColombiaEl Nacho RestaurantUSAEl Origen Foods & DrinksColombiaEl Parche comida colombianaColombiaEl Perico tortas y hamburguesasMéxicoEl PrimogenitoColombiaEl Rambler servicios gastronómicosMéxicoEl Reyna MariscosMéxicoEl Señor de los TacosUSAEl Yopo Brasa y ParrillaColombiaEmiliano la TaqueriaColombiaEmpanadas Factory Los Andes RestaurantUSAEnji Sushi & DrinksMéxicoEnji Sushi CuliacanMéxicoEntre carnes y ManestrasEcuadorEntre SantosUSAEratoColombiaEuphoria gastrobarColombiaFarandula Pizza y RestaurantUSAFeel FitColombiaFelo la serenaColombiaFEMPA Servicios De ComidaDOMINÓS PIZZAFifi's on the BeachUSAFlavors by Jenny GuerraPanamáFLOUruguayFluffy and goColombiaFogo Do MarPerú100 MontaditosUSA4 RegionesEcuadorA toda madreColombiaAcodres Norte de SantanderColombiaAjeno RooftopColombiaAjoloteUSAAlmaColombiaAma las empanadasColombiaAmaranto RestaurantMéxicoAmarisa CafeMéxicoAncestralColombiaArandanos BistróMéxicoArepasCOUSAArroz Paisa El Original Group S.A.SColombiaAsador Ruta del IbéricoEspañaAsados al BarrilColombiaAsados Doña RosaColombiaAtrium pizzas y HamburguesasColombiaAycha SmokeEcuadorBalsámicoColombiaBaraka Café & GrillmEspañaBarbaránColombiaBarrelHouse NYUSABarrica VinotecaColombiaBastimento RestauranteColombiaBataráColombiaBazfexEcuadorBeatrice Pizza e PastaEcuadorBelina GastrobarColombiaBendito caféColombiaBetos Parrilla BoyacenseColombiaBig BitesColombiaBista 4 GastrobarGuatemalaBlac Enjoy S.LEspañaBocas GrillColombiaBochas GrillHondurasBolão Big BurgerSanta Cruz do Rio Pardo / BrasilEspañaBonobonoUSABorgersEcuadorBotalon GrillUSABreads Pasta y parrillaColombiaBrodas Coffee LoungeEcuadorBronte ConnectionPanamáBuffalos La EstacionColombiaBuffankaMéxicoCafe Carola PaisMéxicoCafé DivergenteMéxicoCafé UmaránMéxicoCafe VergaraChileCallejero Social foodColombiaCaramel ChurreríaEspañaCaramelo CafeUSACarneoneColombiaCasa blancaUSACasa NahuatlItaliaCauce CaféMéxicoCayuyo's cookColombiaCazuelitas and GrillColombiaCeviches del esteColombiaChef Dante LLCUSAChef GalloMéxicoChefsolutionUSAChiken KingColombiaChillamicitoBoliviaChiosEcuadorChirivico WingsColombiaCielito Lindo Catering & KitchenUSACiudad ParrillaColombiaClassic BurgerGuatemalaClub Campestre El EstabloVenezuelaCob'sColombiaCochon GrillColombiaCoco PlaceColombiaColombian Mountains CafeUSACoral de fuegoColombiaCreoenbenditoEcuadorCumaco Arepa HouseUSAD’LirasUSADa Noi CafeMéxicoDa Vinci RestauranteVenezuelaDACPUSADAMUColombiaDavid LayaEcuadorDehaler LLC Elizabeth NJUSADel Río restauranteMéxicoDelicias NaturalesColombiaDELIFRANCEColombiaDellacasa Café-BistróBoliviaDelpino RestaurantePerúDenny'sHondurasDiletto BakeryUSADisney Cruise LineUSADivino BistroMéxicoDk cheburgerColombiaDon BennyPerúDon Burrito TexMexChileDon GilColombiaDon Pancho Cascaritas & PernilesEcuadorDon Pedro UniversituUSADonde Pino RestauranteColombiaDudes pizzeriaGuatemalaEaston PAUSAEcplise 2962MéxicoEl Ají RestauranteMéxicoEl automático burgerColombiaEl CafetalUSAEl Carrito SangucheroColombiaEl ChurrascoColombiaEl EdenColombiaEl FanColombiaEl JardinCosta RicaEl Mesón del arrieroColombiaEl Nacho RestaurantUSAEl Origen Foods & DrinksColombiaEl Parche comida colombianaColombiaEl Perico tortas y hamburguesasMéxicoEl PrimogenitoColombiaEl Rambler servicios gastronómicosMéxicoEl Reyna MariscosMéxicoEl Señor de los TacosUSAEl Yopo Brasa y ParrillaColombiaEmiliano la TaqueriaColombiaEmpanadas Factory Los Andes RestaurantUSAEnji Sushi & DrinksMéxicoEnji Sushi CuliacanMéxicoEntre carnes y ManestrasEcuadorEntre SantosUSAEratoColombiaEuphoria gastrobarColombiaFarandula Pizza y RestaurantUSAFeel FitColombiaFelo la serenaColombiaFEMPA Servicios De ComidaDOMINÓS PIZZAFifi's on the BeachUSAFlavors by Jenny GuerraPanamáFLOUruguayFluffy and goColombiaFogo Do MarPerú
Fogon and LionsUSAFogon Food And Drink, C.AUSAFogón MexicanoMéxicoFonda tipicos cocina tradicional colombianaColombiaFotosintesisColombiaFrajaresEcuadorFreddy's FriendsColombiaFreddy's FriendsMéxicoGalo candoUSAGana BistroVenezuelaGardenUSAGarrisonMéxicoGIDOUSAGranja KimParaguayGreen HillHondurasGrupo BP casapaellaColombiaGrupo CFS Coffee ShopUSAGrupo ComidasHondurasGrupo Gastronómico Corazón de mayahuelMéxicoGrupo Guarden GroupUSAGrupo La BoccaPerúGrupo Le Palito SASColombiaGrupo Lidany'sMéxicoGrupo PR Gastronómic GroupPuertoRicoGrupo Puerto Vallarta Mexican Restaurant GroupUSAGrupo Restaurantero GHRDMéxicoGrupo Veho Hospitality GroupUSAHacienda Don JandoPuerto RicoHappy Cream Helados y CaféColombiaHelados MakeruleColombiaHerencia LópezMéxicoHevaen Venezuelan Food LLCUSAHoja de Roble RestauranteMéxicoHoly ChickenVenezuelaHornitos Bakery Llc ClifonUSAHot RodNicaraguaHotel Best WesternColombiaHotel del Arte Santa RitaMéxicoHotel Hacienda Santa BárbaraColombiaHotel KarayaColombiaHotel Portal del Río/RestauranteColombiaHotel restaurante palmas de Santa ElenaColombiaHumoColombiaIbéricos Taverne de tapas espagnolesCanadaIl CastelloColombiaIL NONNO Trattoria de BarrioColombiaInnato Cocina BgaColombiaInstintoUSAInversiones Perritos del MonoColombiaIssa's Venezuelan Food LLCUSAItalianno's, italian RestaurantUSAJamay Manta RayColombiaJera TeppanyakiColombiaJoe'sColombiaKabalVenezuelaKabra grill gastrobarVenezuelaKandela tacos & tequilaUSAKFCHondurasKomel, Tacos y TragosMéxicoKrilColombiaLa BaraccaDinamarcaLa Belle VicoiseFranciaLa Bicicleta LLCUSALa BunkeriaEcuadorLa CanteraMéxicoLa Capilla RestauranteEcuadorLa Casona Coffee houseColombiaLa Casona de antañoMéxicoLa Casona ExpressMéxicoLa Casona restaurant Inc.USALa Choza del Gordo RestauranteUSALa Cocina Elite RestaurantRepublica DominicanaLa Crema Food and GrillUSALa Dura del hornadoEcuadorLa Farándula PizzeriaUSALa Fiambreria de MarcosChileLA FUNDACIÓN 1596MéxicoLa Granja LindaPerúLa GuayabaColombiaLa Hechicera Resto BarColombiaLa libertad Cerro coloradoPerúLa Media VueltaEcuadorLa Mezze del buen Pollo libanésColombiaLa Parrilla Mexican Restaurant-Casi Cielo-La CarretaUSALa Patrona St.ColombiaLa playita seafoodCanadáLa Reyna Mexican CuisineUSALa RomanaColombiaLa Romanezca Restaurante CafeColombiaLa TerrazaVenezuelaLa Torre De PisaColombiaLa Tóxica RestauranteCanadaLa VillaColombiaLanutt BakeryColombiaLas asadas de RigobertaMéxicoLas Chulas Auténtica Comida MexicanaMéxicoLas Espadas de ManoloPerúLas GordibuenasMéxicoLatte CorazonChileLe ParcRepublica DominicanaLeaf RestaurantPanamáLeña SandonaColombiaLeon GuanajuatoMéxicoLepork GourmetColombiaLos SánchezMéxicoLos Tamalitos de BalbuenaMéxicoLotus Flower RestaurantChileLuccaColombiaLucena rooftopColombiaLummy Healthy FoodColombiaLupe restauranteUSAMacob's SAS - Cob's - El ChócoloColombiaMade in MedellinUSAMadero DunasVenezuelaMajestic Portuguese BakehouseUSAMalaga del tropicoColombiaMambo Cuban Restaurant And LoungeUSAManai Wellness KitchenMéxicoMangucciColombiaMareaGuatemalaMartina PescaderiaColombiaMarulaPanamáMatchaCháColombiaMattia RestauranteColombiaMaya DeliciasEspañaMerkavaMéxicoMexico Tesoro NacionalMéxicoMexology ElizabethUSAMexterraEspañaMi Nona CaféColombiaMi VaquitaChileMil AmoresEcuadorMil saboresColombiaMister.A Pollo ApanadoArrecifeMitoaEspañaMiyamoto RestauranteColombiaMontaditas El Rancho BarVenezuelaMorada hoteles y restaurantesMéxicoFogon and LionsUSAFogon Food And Drink, C.AUSAFogón MexicanoMéxicoFonda tipicos cocina tradicional colombianaColombiaFotosintesisColombiaFrajaresEcuadorFreddy's FriendsColombiaFreddy's FriendsMéxicoGalo candoUSAGana BistroVenezuelaGardenUSAGarrisonMéxicoGIDOUSAGranja KimParaguayGreen HillHondurasGrupo BP casapaellaColombiaGrupo CFS Coffee ShopUSAGrupo ComidasHondurasGrupo Gastronómico Corazón de mayahuelMéxicoGrupo Guarden GroupUSAGrupo La BoccaPerúGrupo Le Palito SASColombiaGrupo Lidany'sMéxicoGrupo PR Gastronómic GroupPuertoRicoGrupo Puerto Vallarta Mexican Restaurant GroupUSAGrupo Restaurantero GHRDMéxicoGrupo Veho Hospitality GroupUSAHacienda Don JandoPuerto RicoHappy Cream Helados y CaféColombiaHelados MakeruleColombiaHerencia LópezMéxicoHevaen Venezuelan Food LLCUSAHoja de Roble RestauranteMéxicoHoly ChickenVenezuelaHornitos Bakery Llc ClifonUSAHot RodNicaraguaHotel Best WesternColombiaHotel del Arte Santa RitaMéxicoHotel Hacienda Santa BárbaraColombiaHotel KarayaColombiaHotel Portal del Río/RestauranteColombiaHotel restaurante palmas de Santa ElenaColombiaHumoColombiaIbéricos Taverne de tapas espagnolesCanadaIl CastelloColombiaIL NONNO Trattoria de BarrioColombiaInnato Cocina BgaColombiaInstintoUSAInversiones Perritos del MonoColombiaIssa's Venezuelan Food LLCUSAItalianno's, italian RestaurantUSAJamay Manta RayColombiaJera TeppanyakiColombiaJoe'sColombiaKabalVenezuelaKabra grill gastrobarVenezuelaKandela tacos & tequilaUSAKFCHondurasKomel, Tacos y TragosMéxicoKrilColombiaLa BaraccaDinamarcaLa Belle VicoiseFranciaLa Bicicleta LLCUSALa BunkeriaEcuadorLa CanteraMéxicoLa Capilla RestauranteEcuadorLa Casona Coffee houseColombiaLa Casona de antañoMéxicoLa Casona ExpressMéxicoLa Casona restaurant Inc.USALa Choza del Gordo RestauranteUSALa Cocina Elite RestaurantRepublica DominicanaLa Crema Food and GrillUSALa Dura del hornadoEcuadorLa Farándula PizzeriaUSALa Fiambreria de MarcosChileLA FUNDACIÓN 1596MéxicoLa Granja LindaPerúLa GuayabaColombiaLa Hechicera Resto BarColombiaLa libertad Cerro coloradoPerúLa Media VueltaEcuadorLa Mezze del buen Pollo libanésColombiaLa Parrilla Mexican Restaurant-Casi Cielo-La CarretaUSALa Patrona St.ColombiaLa playita seafoodCanadáLa Reyna Mexican CuisineUSALa RomanaColombiaLa Romanezca Restaurante CafeColombiaLa TerrazaVenezuelaLa Torre De PisaColombiaLa Tóxica RestauranteCanadaLa VillaColombiaLanutt BakeryColombiaLas asadas de RigobertaMéxicoLas Chulas Auténtica Comida MexicanaMéxicoLas Espadas de ManoloPerúLas GordibuenasMéxicoLatte CorazonChileLe ParcRepublica DominicanaLeaf RestaurantPanamáLeña SandonaColombiaLeon GuanajuatoMéxicoLepork GourmetColombiaLos SánchezMéxicoLos Tamalitos de BalbuenaMéxicoLotus Flower RestaurantChileLuccaColombiaLucena rooftopColombiaLummy Healthy FoodColombiaLupe restauranteUSAMacob's SAS - Cob's - El ChócoloColombiaMade in MedellinUSAMadero DunasVenezuelaMajestic Portuguese BakehouseUSAMalaga del tropicoColombiaMambo Cuban Restaurant And LoungeUSAManai Wellness KitchenMéxicoMangucciColombiaMareaGuatemalaMartina PescaderiaColombiaMarulaPanamáMatchaCháColombiaMattia RestauranteColombiaMaya DeliciasEspañaMerkavaMéxicoMexico Tesoro NacionalMéxicoMexology ElizabethUSAMexterraEspañaMi Nona CaféColombiaMi VaquitaChileMil AmoresEcuadorMil saboresColombiaMister.A Pollo ApanadoArrecifeMitoaEspañaMiyamoto RestauranteColombiaMontaditas El Rancho BarVenezuelaMorada hoteles y restaurantesMéxico
Mr CachapaUSAMr PizzaColombiaMr.PubColombiaMyos sushiVenezuelaNativo BarVenezuelaNi-Fu Ni-FaGuatemalaNina Burguer & cocktailsEspañaOffice BurgerColombiaOkane SushiMéxicoOrchid RestaurantCosta RicaOrinoco Food TruckUSAOtabeEcuadorOZ BARUSAPaipa Cheese ExperienceColombiaPanadería KUTYColombiaPanadería y pastelería la mejorColombiaPanaderia ZapatocaColombiaPanda WokHondurasPanela BistróColombiaParador Chito srlRep. DominicanaParceros CafeMéxicoParceros RestauranteEspañaPardosColombia Parrilla Puerta Norte (MéxicoParrillisimoColombiaPasta y basta ECEcuadorPepiteria 13VenezuelaPepitos GrillEcuadorPernilones OrquídeasColombiaPickers CoffeeColombiaPikeo PicnicColombiaPizza e puntoCosta RicaPizza HutHondurasPizzeria BocapizzaEspañaPizzeria la GrottaVenezuelaPlaneta WingsColombiaPlaya BichisMéxicoPlaza Azteca Short Pump IncUSAPollo Brasa y Sazon / Brasa y SazonUSAPollo DoradoVenezuelaPomonaMéxicoPork barrel gastro barColombiaPorti sas / Neblinas RestauranteColombiaPorto AltoColombiaPosada Gastronomica Rincon TachirenseVenezuelaQue papasChileQuintaPuertaChileRanch Texas Express RestauranteColombiaRaviolo bar de pastasPerúRecetario Belén de umbríaColombiaRest Francesco'sMéxicoRest. Alma & FuegoNicaraguaRestaurant Los Generales RevolucionariosMéxicoRestaurant Tacos tj 664USARestaurante BRIYOMéxicoRestaurante Carta AjenaColombiaRestaurante Chicali TownMéxicoRestaurante ChillinPanamáRestaurante de Comidas Rápidas Donde JuanchoColombiaRestaurante DiventoEspañaRestaurante el CarbonazoEcuadorRestaurante el TrébolMéxicoRestaurante EsenciaColombiaRestaurante Finca los lagosColombiaRestaurante Kayma FusiónEspañaRestaurante La CarretaMéxicoRestaurante La Flor de la CanelaColombiaRestaurante La Fonda de toda la VidaMéxicoRestaurante La margaritaColombiaRestaurante La PampeColombiaRestaurante La Pampe! STEAK HOUSEColombiaRestaurante Lineas de NazcaPerúRestaurante Los danzantesMéxicoRestaurante María NamenColombiaRestaurante Matsuri IzakayaMéxicoRestaurante Mulata CriollaColombiaRestaurante ParcerosEspañaRestaurante Pescadería Mar azulColombiaRestaurante Picapiedra LMCColombiaRestaurante Río QuintanaMéxicoRestaurante Sabor AndinoItaliaRestaurante SairaColombiaRestaurante Tribal Los del Chicharrón TotiadoColombiaRestaurante YucaoColombiaRestaurantes PADColombiaRestobar Ranchero's Sabor sin fronterasMéxicoRice and beans Cuban cuisineUSARoatán Beach GardenChileRoman RestauranteColombiaRotterdamRotterdam. NetherlandsSan Marcos Mexican restaurantUSASanta Juana GastrobarColombiaSanta PeccatoSanta Cruz BoliviaSanto CharroEl salvadorSanto PeccatoBoliviaSelváticoColombiaSeñor ChinoVenezuelaSeñor JalapeñoUSASeñor StoneMéxicoSopas y Picadas villa inesColombiaSour By El EsconditeecuadorStop BurgerColombiaStreet CrustUSAStudio Media MarketingUSASushi by UsUSASushi Valle VolcanesChileSushi ZoneMéxicoSweet ArtColombiaTa tabluoColombiaTacos del CartelUSATaquería La NacionalMéxicoTaquito GrillMéxicoTateti after schoolArgentinaTequila Mexican Grill & BarUSAThe Buffalo HouseColombiaThe Dinner HouseBelizeThe GardenUSAThe Summit ProjectUSAToidoi Cantina VietnamitaGuatemalaTopicsColombiaTopping Burgers S.A.SColombiaTrattoria Limoncello CAVenezuelaTributo GastrobarColombiaTrilogía Restaurante BarColombiaTronchatoro PasteleríaColombiaTropico Latin FlavorsNetherlandsTropique food clubColombiaTu momento CafeVenezuelaUnión Gastronómica de Santiago Asociación UGASARep. DominicanaUnión Latino's Restaurant and BarCanadáUrban WingsMéxicoViajante CaféMéxicoW SUSHI BAR/W SUSHI XPRESSPuerto RicoWenaBurgerChileWine MarketMéxicoWingdogColombiaXhalo's Café BarMéxicoZokai Sushi & CevicheChileMr CachapaUSAMr PizzaColombiaMr.PubColombiaMyos sushiVenezuelaNativo BarVenezuelaNi-Fu Ni-FaGuatemalaNina Burguer & cocktailsEspañaOffice BurgerColombiaOkane SushiMéxicoOrchid RestaurantCosta RicaOrinoco Food TruckUSAOtabeEcuadorOZ BARUSAPaipa Cheese ExperienceColombiaPanadería KUTYColombiaPanadería y pastelería la mejorColombiaPanaderia ZapatocaColombiaPanda WokHondurasPanela BistróColombiaParador Chito srlRep. DominicanaParceros CafeMéxicoParceros RestauranteEspañaPardosColombia Parrilla Puerta Norte (MéxicoParrillisimoColombiaPasta y basta ECEcuadorPepiteria 13VenezuelaPepitos GrillEcuadorPernilones OrquídeasColombiaPickers CoffeeColombiaPikeo PicnicColombiaPizza e puntoCosta RicaPizza HutHondurasPizzeria BocapizzaEspañaPizzeria la GrottaVenezuelaPlaneta WingsColombiaPlaya BichisMéxicoPlaza Azteca Short Pump IncUSAPollo Brasa y Sazon / Brasa y SazonUSAPollo DoradoVenezuelaPomonaMéxicoPork barrel gastro barColombiaPorti sas / Neblinas RestauranteColombiaPorto AltoColombiaPosada Gastronomica Rincon TachirenseVenezuelaQue papasChileQuintaPuertaChileRanch Texas Express RestauranteColombiaRaviolo bar de pastasPerúRecetario Belén de umbríaColombiaRest Francesco'sMéxicoRest. Alma & FuegoNicaraguaRestaurant Los Generales RevolucionariosMéxicoRestaurant Tacos tj 664USARestaurante BRIYOMéxicoRestaurante Carta AjenaColombiaRestaurante Chicali TownMéxicoRestaurante ChillinPanamáRestaurante de Comidas Rápidas Donde JuanchoColombiaRestaurante DiventoEspañaRestaurante el CarbonazoEcuadorRestaurante el TrébolMéxicoRestaurante EsenciaColombiaRestaurante Finca los lagosColombiaRestaurante Kayma FusiónEspañaRestaurante La CarretaMéxicoRestaurante La Flor de la CanelaColombiaRestaurante La Fonda de toda la VidaMéxicoRestaurante La margaritaColombiaRestaurante La PampeColombiaRestaurante La Pampe! STEAK HOUSEColombiaRestaurante Lineas de NazcaPerúRestaurante Los danzantesMéxicoRestaurante María NamenColombiaRestaurante Matsuri IzakayaMéxicoRestaurante Mulata CriollaColombiaRestaurante ParcerosEspañaRestaurante Pescadería Mar azulColombiaRestaurante Picapiedra LMCColombiaRestaurante Río QuintanaMéxicoRestaurante Sabor AndinoItaliaRestaurante SairaColombiaRestaurante Tribal Los del Chicharrón TotiadoColombiaRestaurante YucaoColombiaRestaurantes PADColombiaRestobar Ranchero's Sabor sin fronterasMéxicoRice and beans Cuban cuisineUSARoatán Beach GardenChileRoman RestauranteColombiaRotterdamRotterdam. NetherlandsSan Marcos Mexican restaurantUSASanta Juana GastrobarColombiaSanta PeccatoSanta Cruz BoliviaSanto CharroEl salvadorSanto PeccatoBoliviaSelváticoColombiaSeñor ChinoVenezuelaSeñor JalapeñoUSASeñor StoneMéxicoSopas y Picadas villa inesColombiaSour By El EsconditeecuadorStop BurgerColombiaStreet CrustUSAStudio Media MarketingUSASushi by UsUSASushi Valle VolcanesChileSushi ZoneMéxicoSweet ArtColombiaTa tabluoColombiaTacos del CartelUSATaquería La NacionalMéxicoTaquito GrillMéxicoTateti after schoolArgentinaTequila Mexican Grill & BarUSAThe Buffalo HouseColombiaThe Dinner HouseBelizeThe GardenUSAThe Summit ProjectUSAToidoi Cantina VietnamitaGuatemalaTopicsColombiaTopping Burgers S.A.SColombiaTrattoria Limoncello CAVenezuelaTributo GastrobarColombiaTrilogía Restaurante BarColombiaTronchatoro PasteleríaColombiaTropico Latin FlavorsNetherlandsTropique food clubColombiaTu momento CafeVenezuelaUnión Gastronómica de Santiago Asociación UGASARep. DominicanaUnión Latino's Restaurant and BarCanadáUrban WingsMéxicoViajante CaféMéxicoW SUSHI BAR/W SUSHI XPRESSPuerto RicoWenaBurgerChileWine MarketMéxicoWingdogColombiaXhalo's Café BarMéxicoZokai Sushi & CevicheChile
Toolkit MASTERESTAURANT®
Related tools
From the same toolkit (tool pages in Spanish), chosen by closeness to this tool.
 MASTERESTAURANT®